Core-Cast is our nowcasting model to track the Fed's preferred inflation gauges before and through their release date. The heatmaps below give a comprehensive view of how inflation components and themes are performing relative to what transpires when inflation is running at 2%.
Most of the Personal Consumption Expenditures (PCE) inflation gauges are sourced from Consumer Price Index (CPI) data, but Producer Price Index (PPI) input data is of increasing relevance, import price index (IPI) data can prove occasionally relevant. There are also some high-leverage components that only come out on the day of the PCE release. If you appreciate our nowcasting capabilities, consider becoming a Premium Donor.
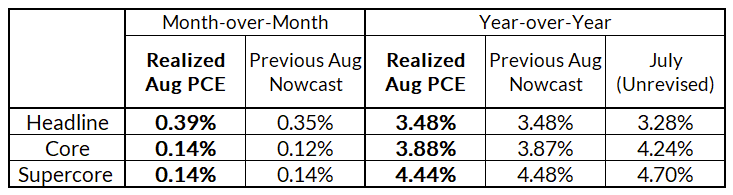
Bottom Line: There wasn't much new info in this monthly PCE release relative to our nowcasts; merely confirmation that core PCE is indeed running at 3.9% Y/Y, and 2.2% on 3-month annualized basis. The median FOMC member's core PCE projections for 2023Q4 continue to look ripe for downward revision (from 3.7% Y/Y to 3.3-3.5% Y/Y). We are therefore not moving our baseline Fed outlook: (1) no hike in Q4 and (2) the Fed will begin cutting in summer 2024. It's possible the Fed could cut in May 2024, but it's difficult to see earlier cuts in the absence of material hard landing risk emerging.
Summary
Our nowcasts were about as accurate as you could have hoped for (both following yesterday's GDP release and throughout this monthly cycle). Interestingly, downside revisions to wage-based input cost indices and imputed financial services now correct for some of our previous nowcast "errors" (where we modeled more weakness than showed up at the time...).
The two points that stick out to us from this round of GDP / PCE data are the revisions to the "dark spaces" of PCE not spanned directly by CPI, PPI, or Import Price source data: (1) wage-based input cost indices, and (2) imputed financial services.
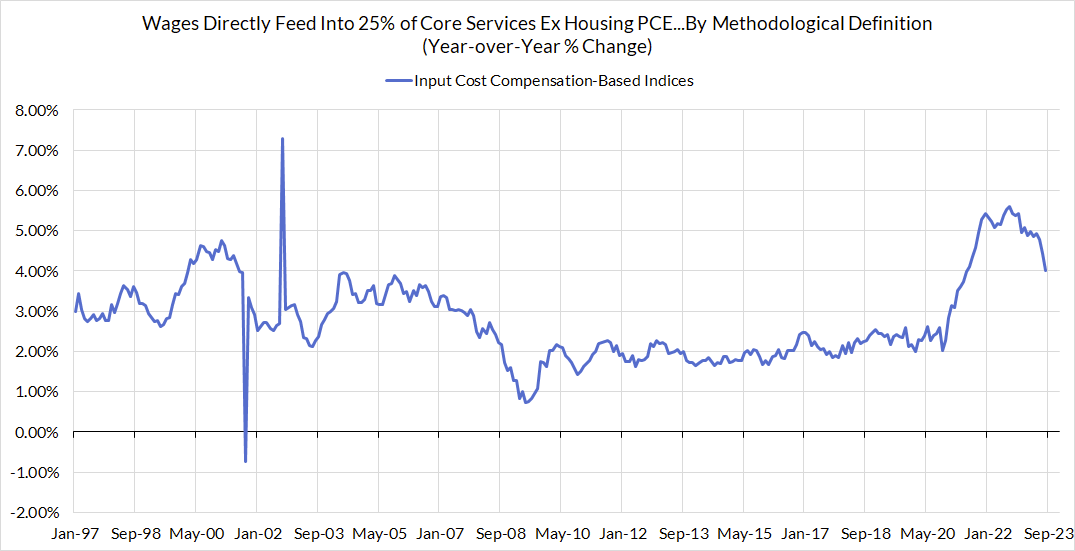
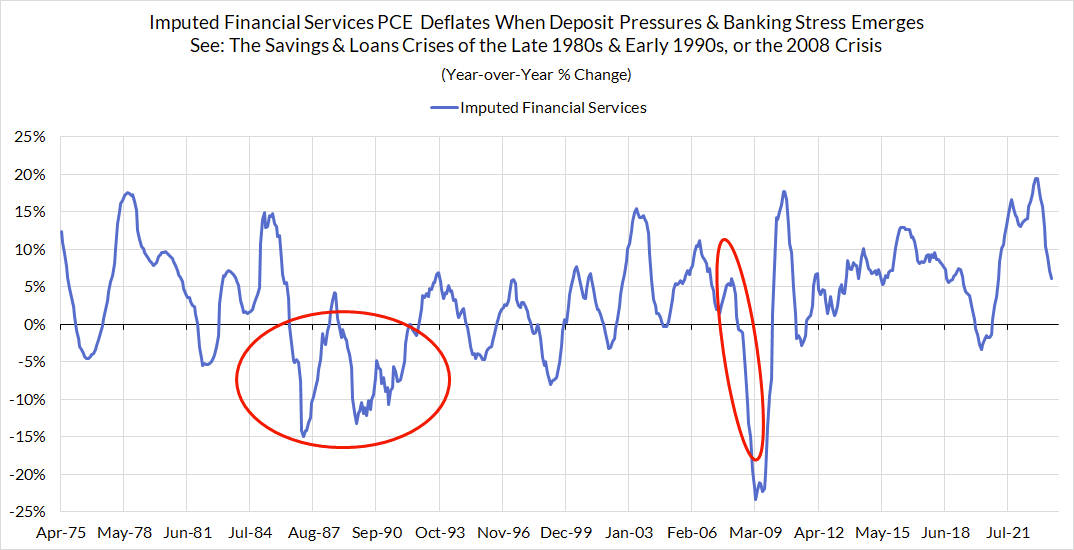
Both of these categories should support further disinflation so long as (1) wages & broad commodity PPIs keep decelerating, and (2) deposit rates show additional convergence to benchmark short-term interest rates (and/or bank lending volumes slow further). We would warn that both of these categories are vulnerable to further revision in the coming months. But given what we know today, the math is definitely getting easier for the Fed to achieve and sustain 2% core PCE outcomes, and comparable supercore PCE outcomes (there's ~0.68% upward bias to supercore categories over core).
John Williams comments today signal to us that the Fed will belatedly acknowledge progress on Core PCE. Even under conservative assumptions, core PCE should underperform the median FOMC member's projections for year-end. 3.7% Y/Y Core PCE in 2023Q4 would merely require monthly readings to average 32 basis points. 20 basis points are probably a better baseline. 3.3-3.5% is the more likely range for Core PCE to end the year.
For the Detail-Oriented: Core PCE Heatmaps
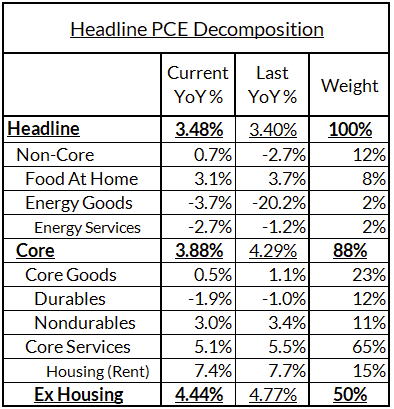
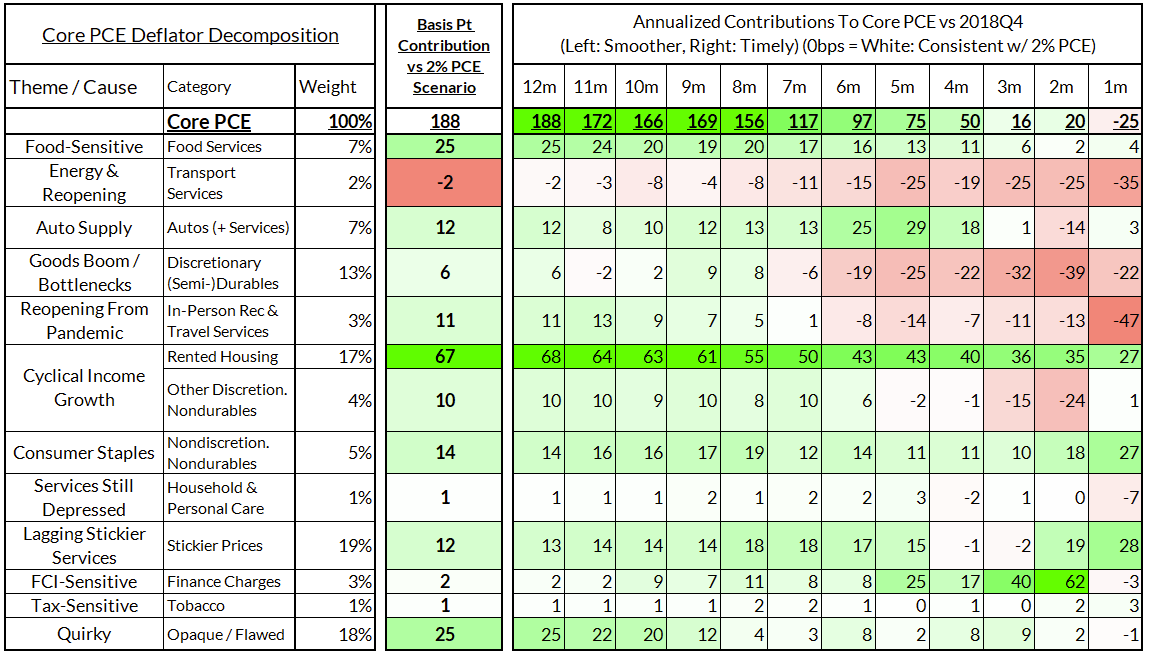
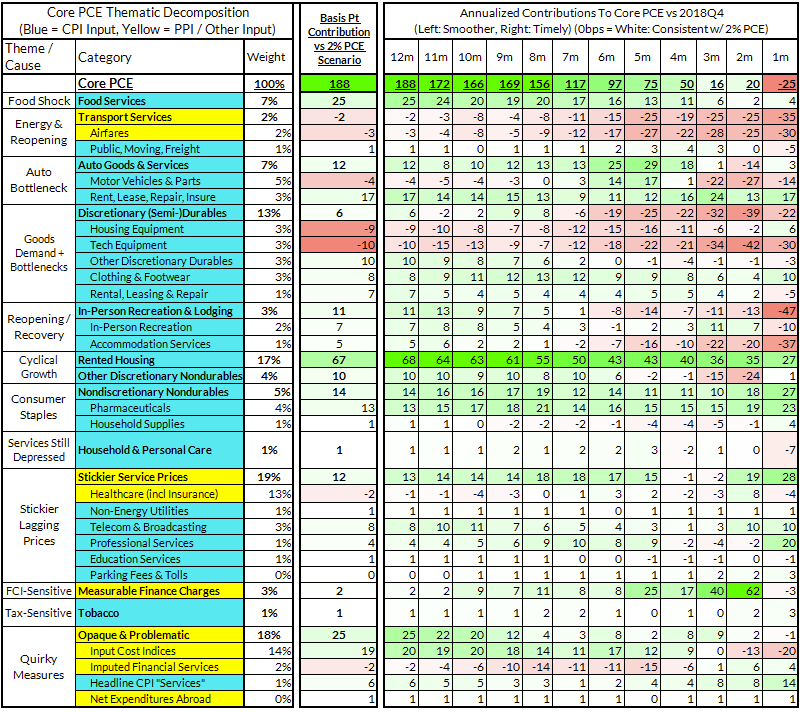
Right now Core PCE (PCE less food products and energy) is running at 3.88% on a year-over- as of August, 188 basis points above the Fed's 2% inflation target for PCE. That overshoot is disproportionately driven by catch-up rent CPI inflation in response to the surge in household formation (a byproduct of rapidly recovering job growth) and market rents in 2021-22. Rent is contributing 67 basis points to the 188 basis point core PCE overshoot.
There are other contributors to the overshoot:
- Some more supply-driven (automobile bottlenecks likely explain 12 basis points, while food inputs likely added 26 basis points to the overshoot)
- Some more demand-driven (in-person recreation and travel services adding 11 basis points to the overshoot)
- So with demand- and supply-side drivers (consumer staples and other discretionary goods adding 30 basis points).
- Some oddball segments have offsetting effects (measured financial service charges now adding 2 basis points, while contributions from input cost indices and imputed financial services add 17 basis points to Core PCE vs 2%-consistent outcomes).
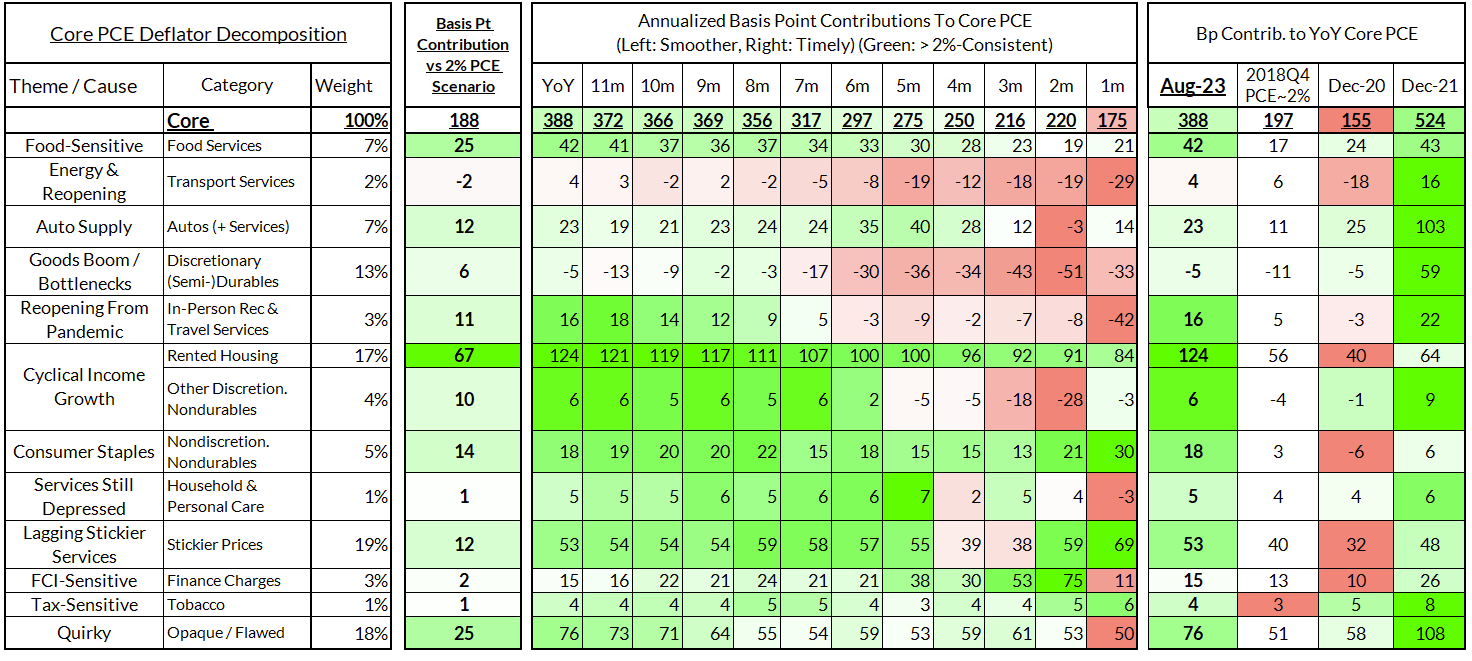
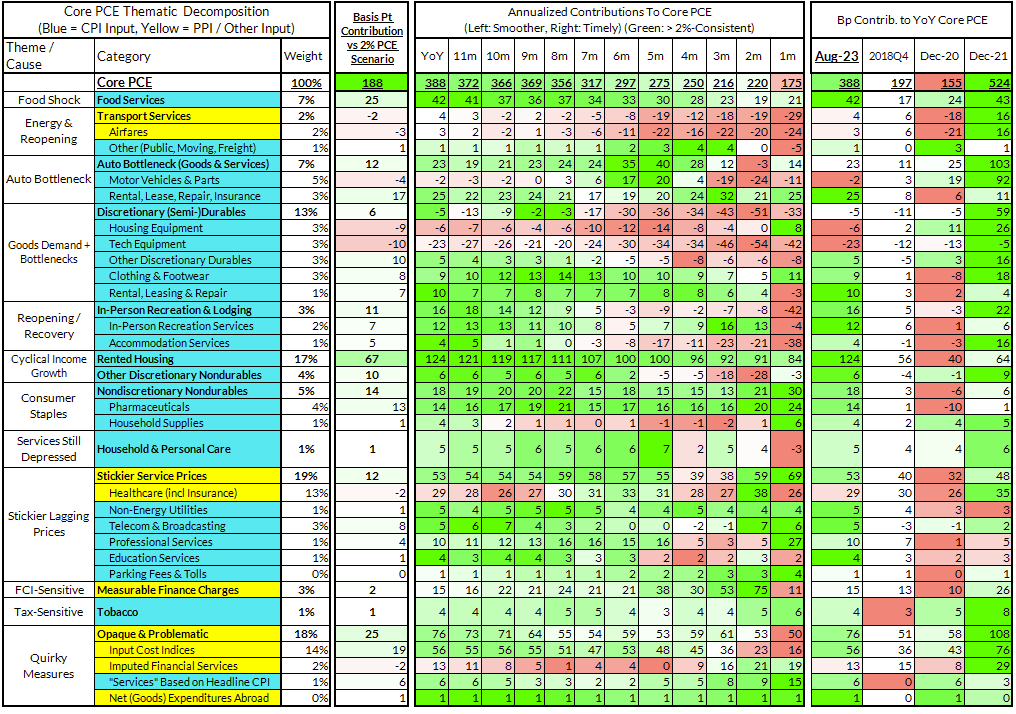
The final two heat maps below gives you a sense of the overshoot on shorter annualized run-rates. August monthly annualized core PCE yields a 25 basis point undershoot vs 2% target inflation (1.75% annualized), but we would flag that monthly PCE revisions and BEA indices for input costs and imputed financial services can drive a decent swing in the final PCE outcome.
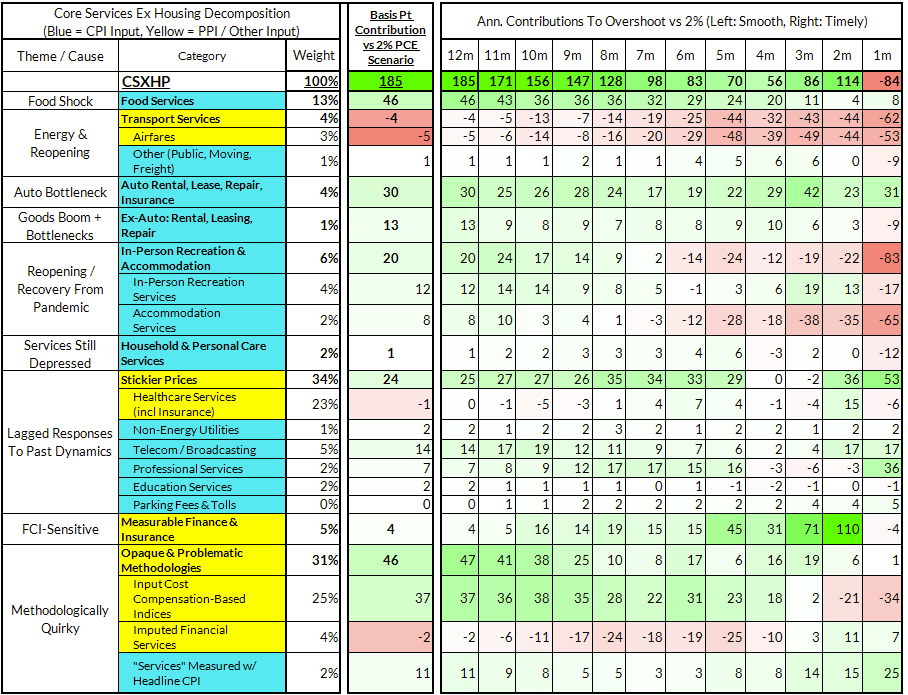
For the Detail-Oriented: Core Services Ex Housing PCE Heatmaps
The August growth rate in "Core Services Ex Housing" ('supercore') PCE is on track to run at 4.44% year-over-year, a 185 basis point overshoot versus the 2.68% run rate that coincided with ~2% headline and core PCE.
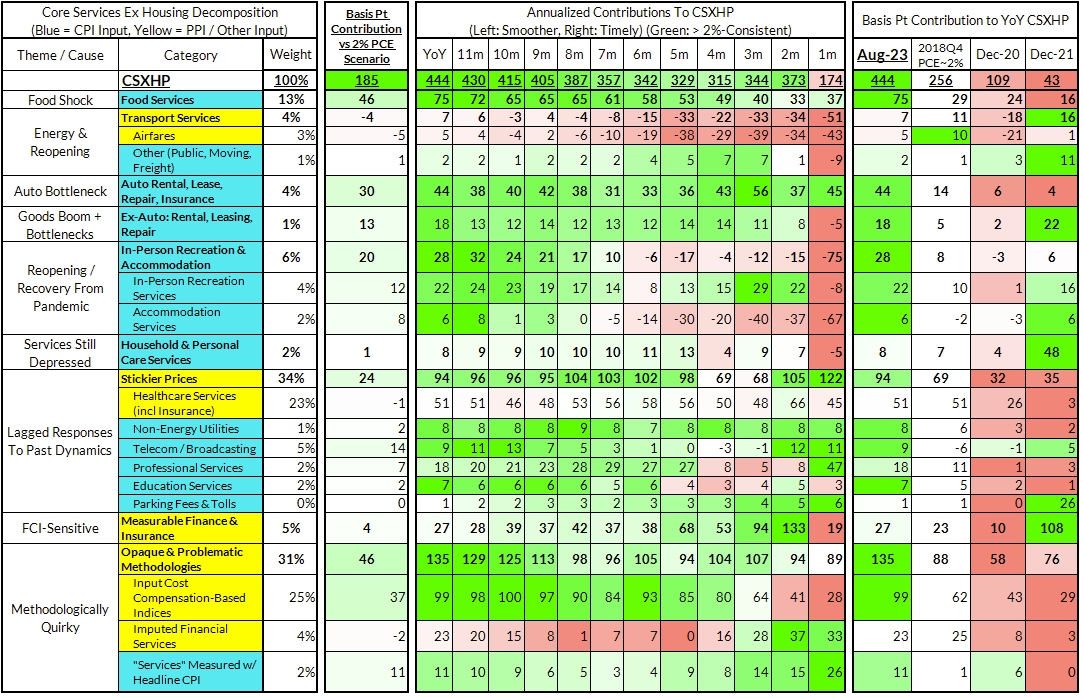
August monthly supercore ran at a 1.74% annualized rate, an 84 basis point undershoot of what would be consistent with 2% headline and core PCE.