March Core-Cast Post-PCE: Rounding Out A Disappointing Q1

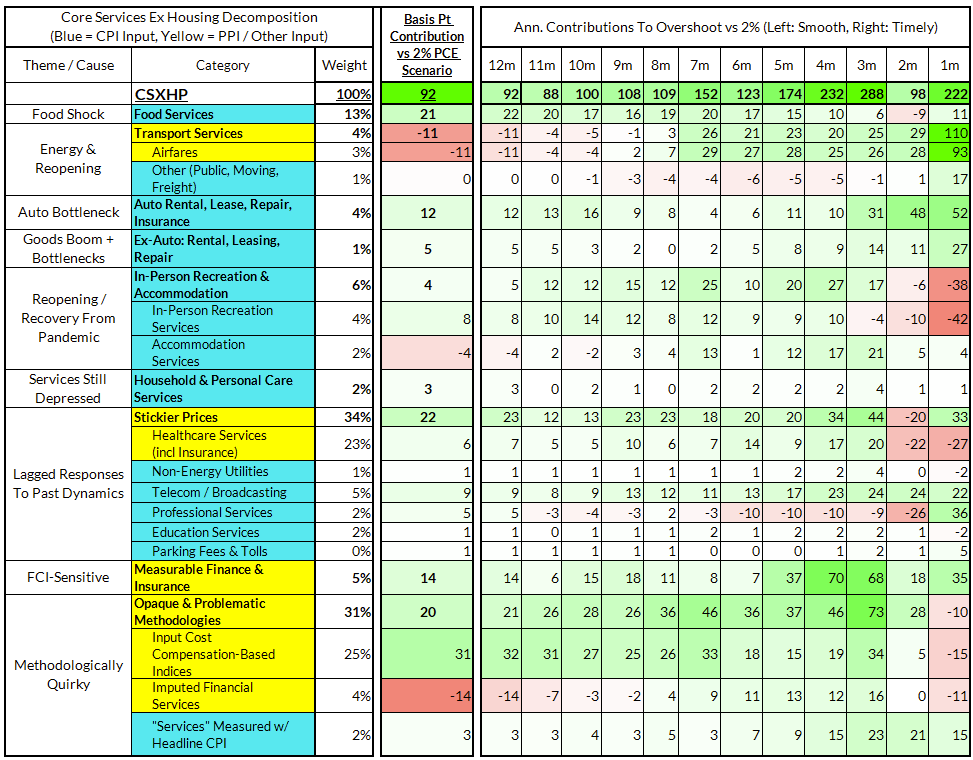
Core-Cast is our nowcasting model to track the Fed's preferred inflation gauges before and through their release date. The heatmaps below give a comprehensive view of how inflation components and themes are performing relative to what transpires when inflation is running at 2%.
Most of the Personal Consumption Expenditures (PCE) inflation gauges are sourced from Consumer Price Index (CPI) data, but Producer Price Index (PPI) input data is of increasing relevance, import price index (IPI) data can prove occasionally relevant. There are also some high-leverage components that only come out on the day of the PCE release.
If you'd like to start a 90-day free trial of our exclusive content, you can do so using this link. If you have any questions or would like to see samples of our past content, feel free to get in touch with us.
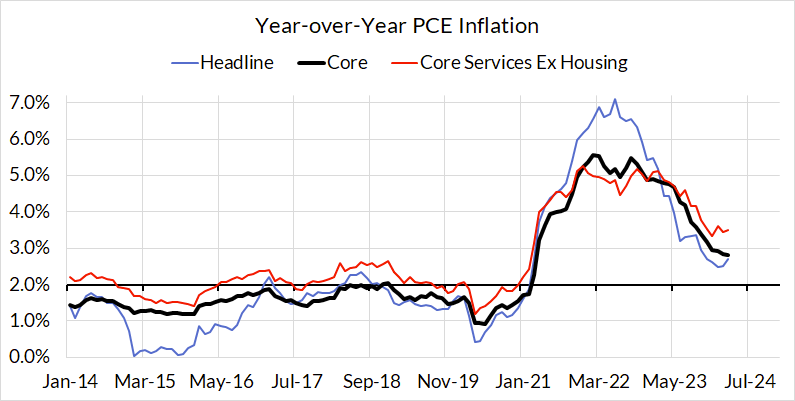
Q1 was filled with a series of upside inflation surprises. While we warned from the outset that Q1 was fat-tailed in the distribution of possible inflationary outcomes, the strength of inflation certainly surprised us and surely surprised the Fed as well. It does not mean that the disinflationary process has come to an end, and in fact, year-over-year readings are still meaningfully lower than where they were 6-12 months ago, but Q1 was a meaningful bump in the road.
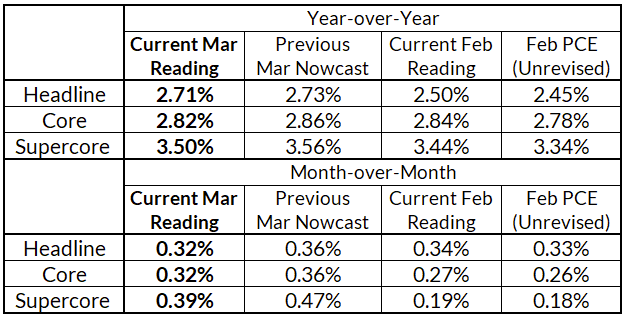
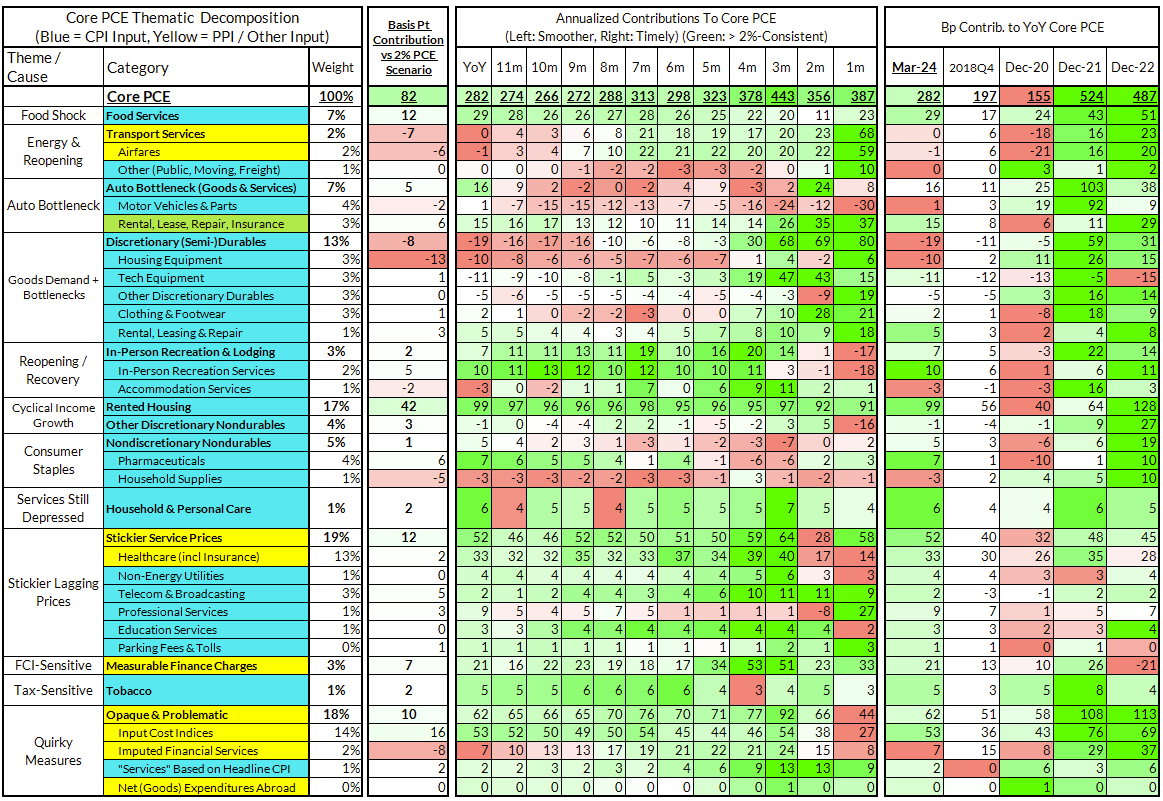
Today we mostly learned that the inflation upside in Q1, after accounting for revisions, was concentrated in January and that March Core PCE readings were actually marginally more benign than what we were nowcasting. Perhaps most encouragingly, in the monthly estimates, here are still signs of further disinflation in BEA indices for input costs and imputed financial service prices, boding well for further supercore disinflation later this year. That said, the deviations are ultimately marginal and do not change our baseline view: the first interest rate reduction is most likely to transpire in September.
We are still optimistic on the prospects for further disinflation this year.
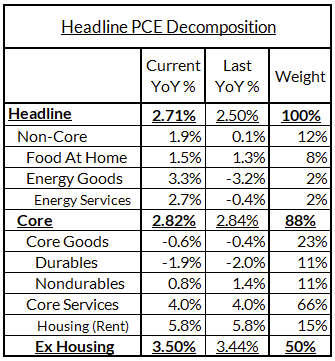
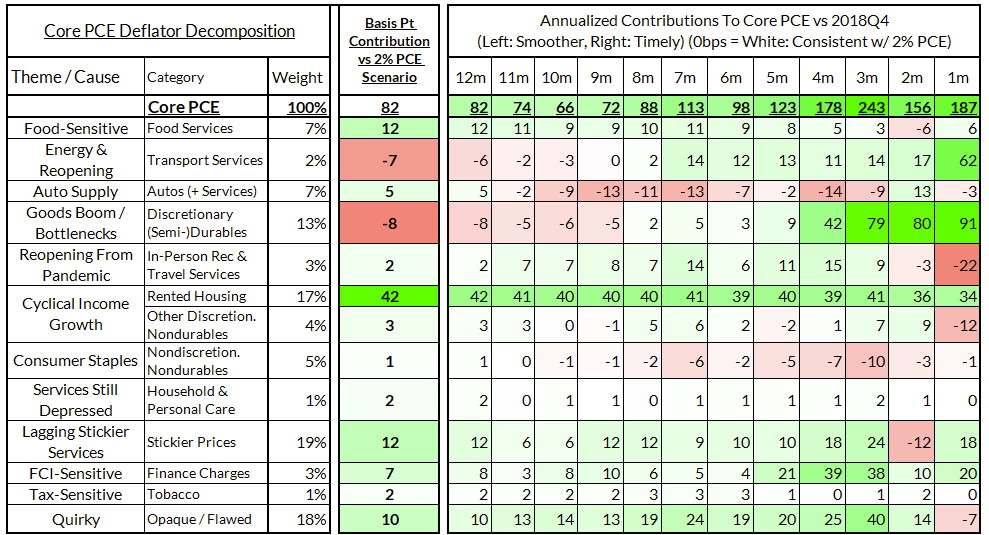
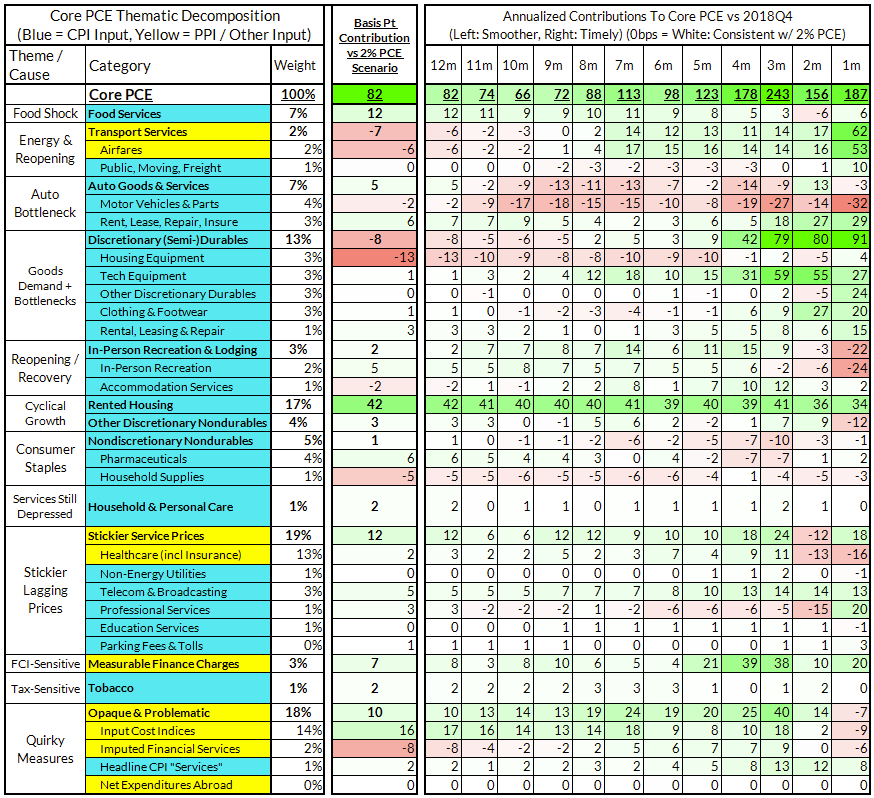
Core PCE (PCE less food products and energy) ran at a 2.82% year-over-year pace as of March, 82 basis points above the Fed's 2% inflation target for PCE. That overshoot is disproportionately driven by catch-up rent CPI inflation in response to the surge in household formation (a byproduct of rapidly recovering job growth) and market rents in 2021-22. Rent is contributing 42 basis points to the 86 basis point core PCE overshoot.
There are other contributors to the overshoot:
The final heatmap below gives you a sense of the overshoot on shorter annualized run-rates. March monthly annualized core PCE yielded a 187 basis point overshoot vs 2% target inflation (3.87% annualized).
The March growth rate in "Core Services Ex Housing" ('supercore') PCE ran at 3.50% year-over-year, a 92 basis point overshoot versus the ~2.59% run rate that coincided with ~2% headline and Core PCE.
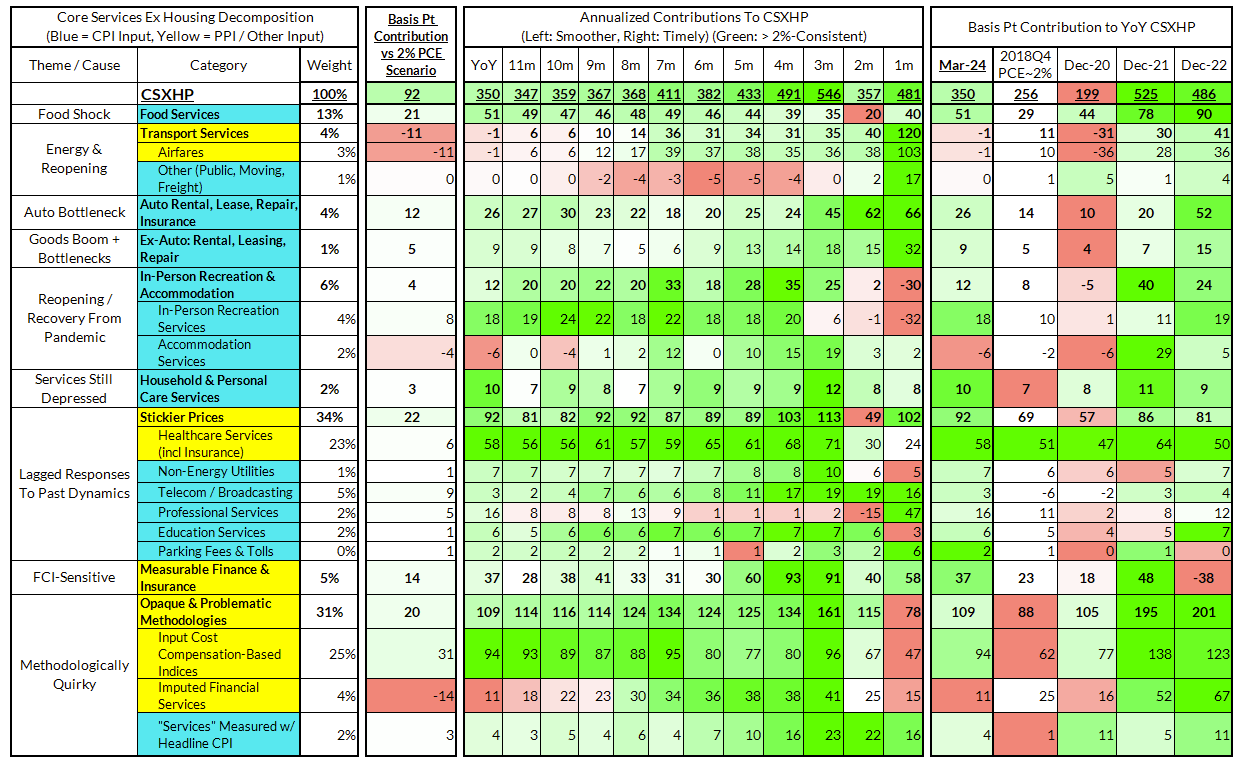
March monthly supercore ran ata 4.81% annualized rate, a 222 basis point annualized overshoot of what would be consistent with 2% headline and core PCE.