Core-Cast is our nowcasting model to track the Fed's preferred inflation gauges before and through their release date. The heatmaps below give a comprehensive view of how inflation components and themes are performing relative to what transpires when inflation is running at 2%.
Most of the Personal Consumption Expenditures (PCE) inflation gauges are sourced from Consumer Price Index (CPI) data, but Producer Price Index (PPI) input data is of increasing relevance, import price index (IPI) data can prove occasionally relevant. There are also some high-leverage components that only come out on the day of the PCE release. Reach out to us if you would like to become a Premium Donor to support and access all of our research content.
Summary
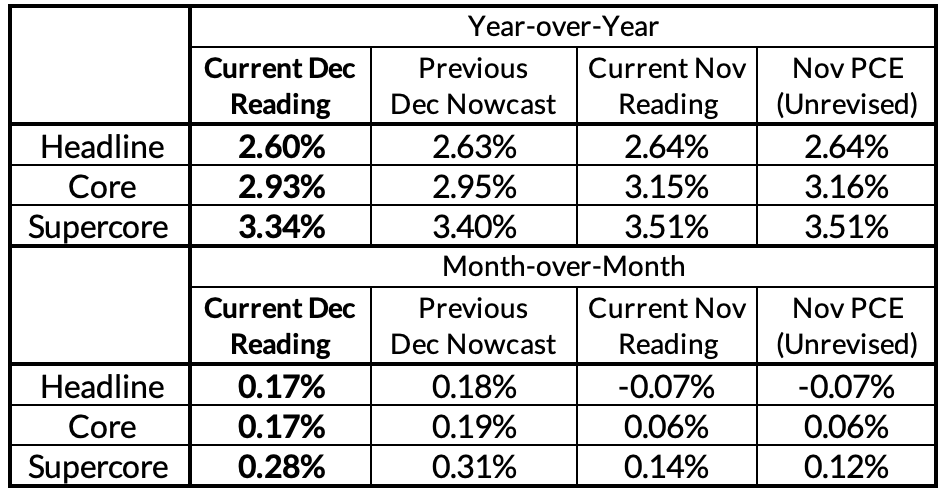
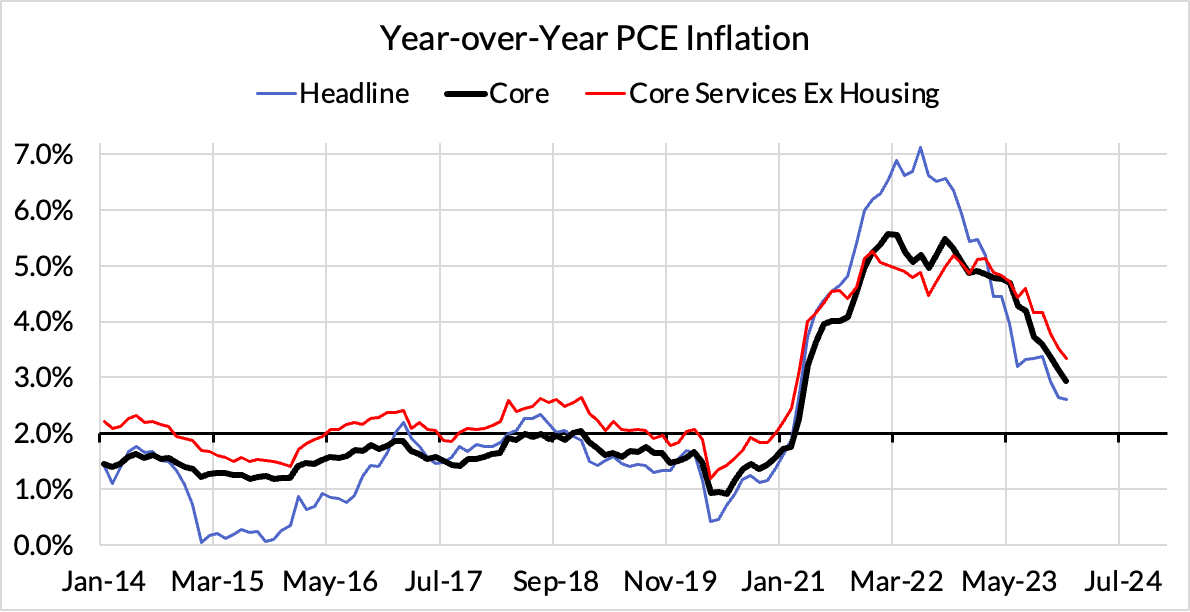
The latest nowcasts we published were after December PPI and were basically in line with what we learned yesterday (quarterly data) and today (monthly data). GDP data showed slightly more downside relative to what we penciled in after PPI (off by 2 basis points). Today's final data showed no additional surprises. Core PCE is running under 3% on a year-over-year basis. That in and of itself is quite the milestone, but the momentum over the past 7-8 months suggests that 2% PCE inflation outcomes may not be that far away.
Commentary
Soft 2023H2 core inflation makes 2024Q1 inflation potentially pivotal to the case for a March cut (assuming the labor market does not deteriorate). Q1 inflation has run exceptionally hot in the past two calendar years and especially so for January and February (average: 0.44% m/m). Which means that what we get from January will likely affect our forecasts for inflation in February and thus the timeline for achieving 2%. A hot January will increase the odds of a hot February. A cool January will increase the odds of a cool February.
If January and February merely comes in warm (0.25%-0.30%), the base effects and residual seasonality associated with these months can still give the Fed sufficient confidence to begin normalizing interest rates in March. Should Core PCE appear even cooler (anything lower than 2.56% year-over-year on their nowcasts at the FOMC meeting), the case for cutting interest rates in March should be unambiguous.
Respect the fat tails involved in January and February inflation data. Core PCE could plausibly produce monthly readings ranging from 0.1% to 0.5% over the next two months. There are good reasons to think January and February PCE inflation might still remain hot (above 0.35% month-over-month) due to structural shifts in seasonal pricing patterns post-pandemic. There are also good reasons to believe January and February PCE inflation might be substantially cooler than prior years because the concentration of January and February upside was a goods price phenomenon (and thus merely a lagged response to surging commodity prices and broken supply chains). Used cars deflation also appears to be a helpful tailwind.
Why cut if growth is still good? The reason most FOMC members opted for raising interest rates all the way to 5.33% was that core inflation continued to run at or above 3.5%-4% for most of the hiking cyle. While members expressed hope that such inflation rates would not stick, implied policy rules suggested that they at least raise interest rates in a manner commensurate to those inflation outcomes. Even if we do reach 2%, it will indeed take more time to figure out the sustainability of that outcome. Nevertheless, we are already getting an accumulation of evidence to suggest inflation is not stuck at 3.5%-4%. Thus, it need not require such highly restrictive policy rates to achieve 2% over the longer run.
50 basis point cuts depend on the January employment report. If the labor market shows similar deterioration in January that it showed in December, growth and inflation could be compounding reasons for the Fed to cut at a faster pace. We're not sure how much of the December labor market data weakness reflects noisy deceleration or outright deterioration. We'll have a better grasp after the next employment report (next Friday).
For the Detail-Oriented: Core PCE Heatmaps
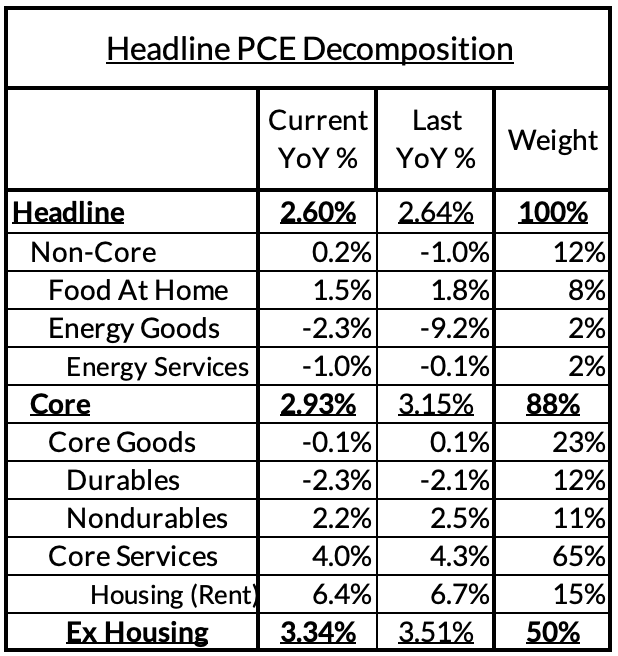
Right now Core PCE (PCE less food products and energy) is on track to run at a 2.93% year-over-year pace as of December, 93 basis points above the Fed's 2% inflation target for PCE. That overshoot is disproportionately driven by catch-up rent CPI inflation in response to the surge in household formation (a byproduct of rapidly recovering job growth) and market rents in 2021-22. Rent is contributing 51 basis points to the 95 basis point core PCE overshoot.
There are other contributors to the overshoot:
- Some more supply-driven (food inputs likely added 19 basis points to the overshoot)
- Some more demand-driven (in-person recreation and travel services likely added 9 basis points to the overshoot)
- So with demand- and supply-side drivers (consumer staples and discretionary goods likely added 6 basis points).
- Some oddball segments have offsetting effects (measured financial service charges now subtracting 6 basis points, while contributions from input cost indices and imputed financial services likely adding 3 basis points to Core PCE vs 2%-consistent outcomes).
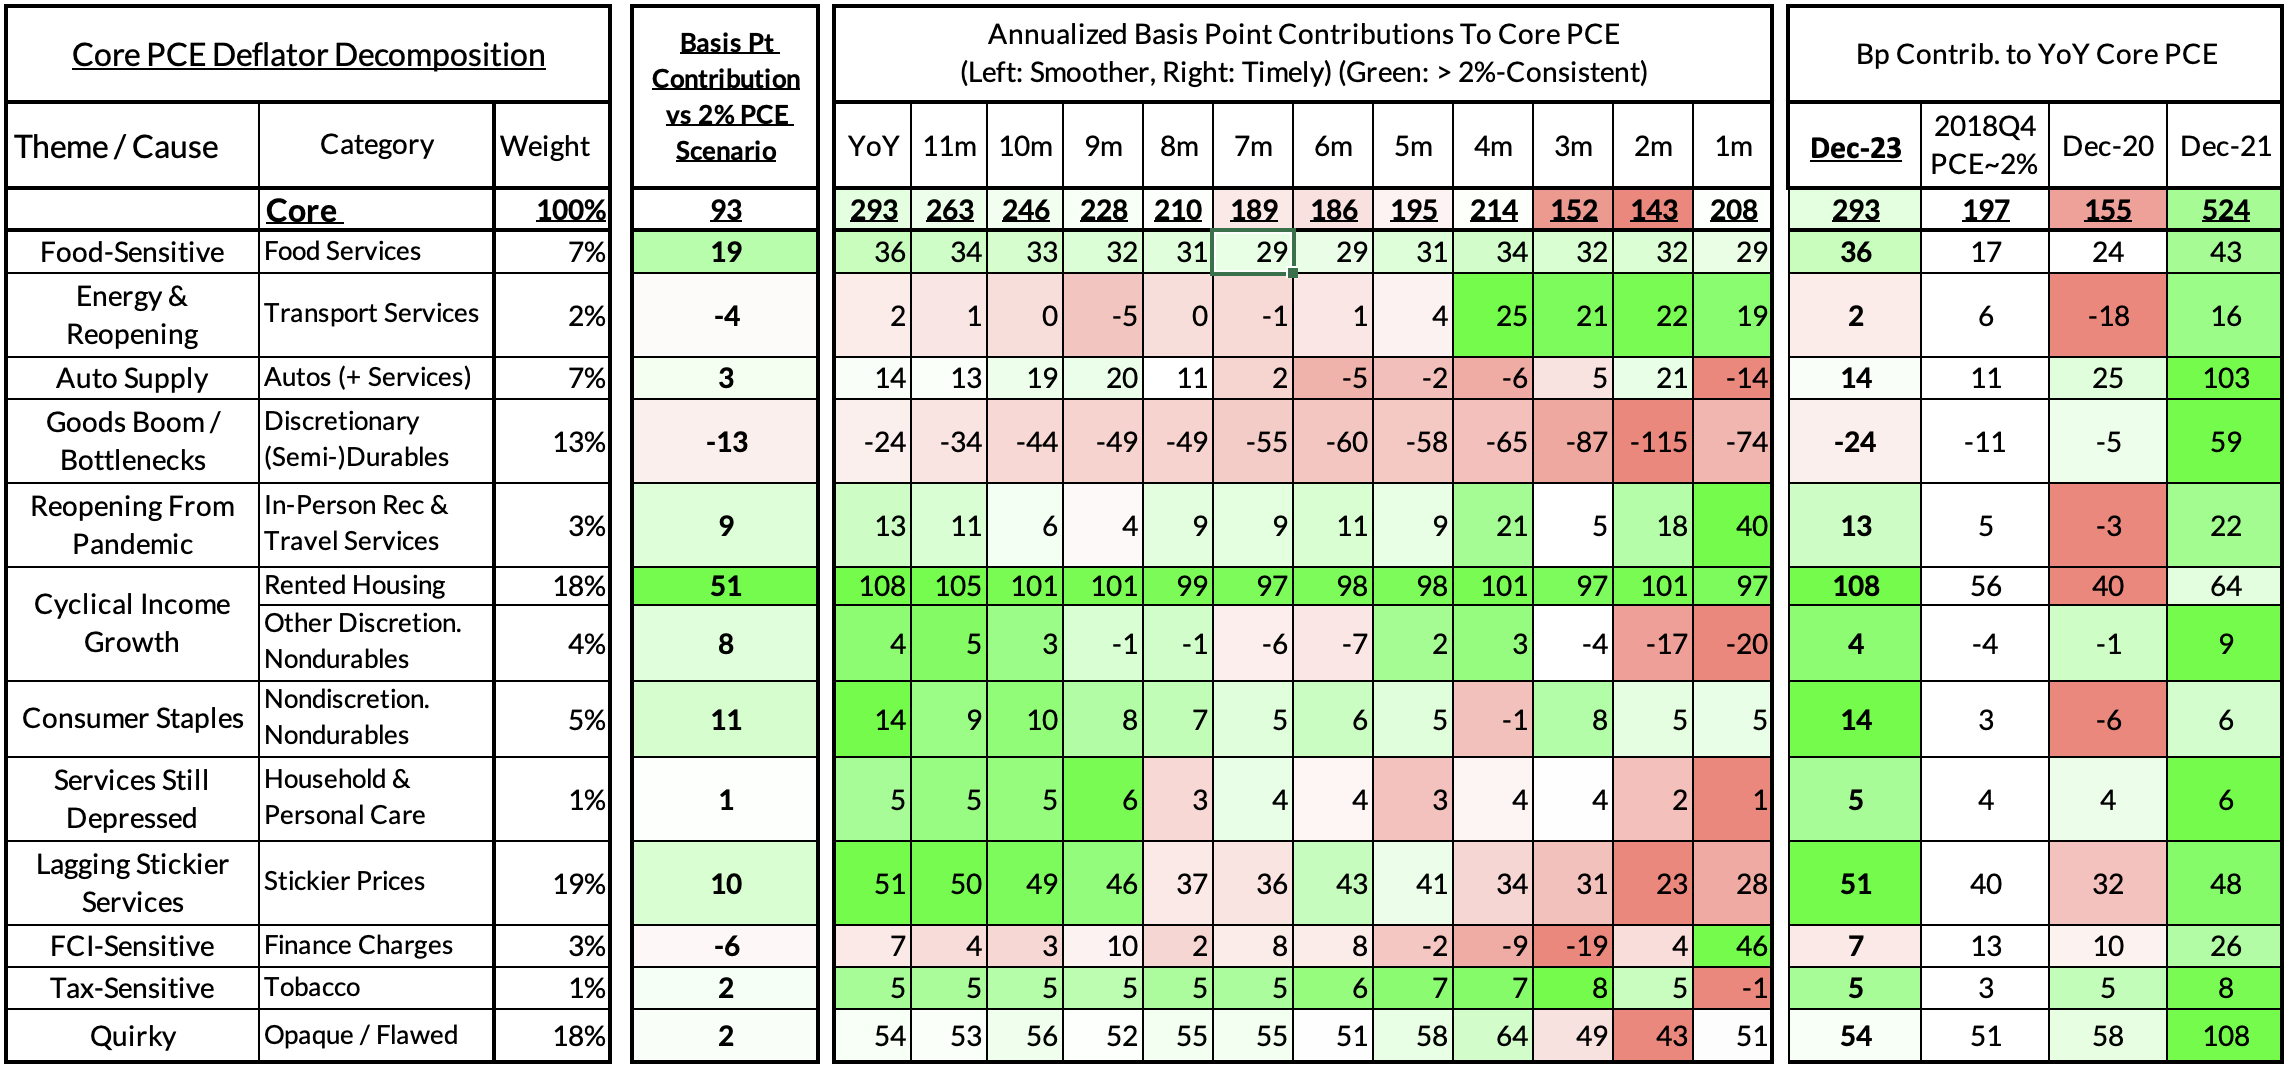
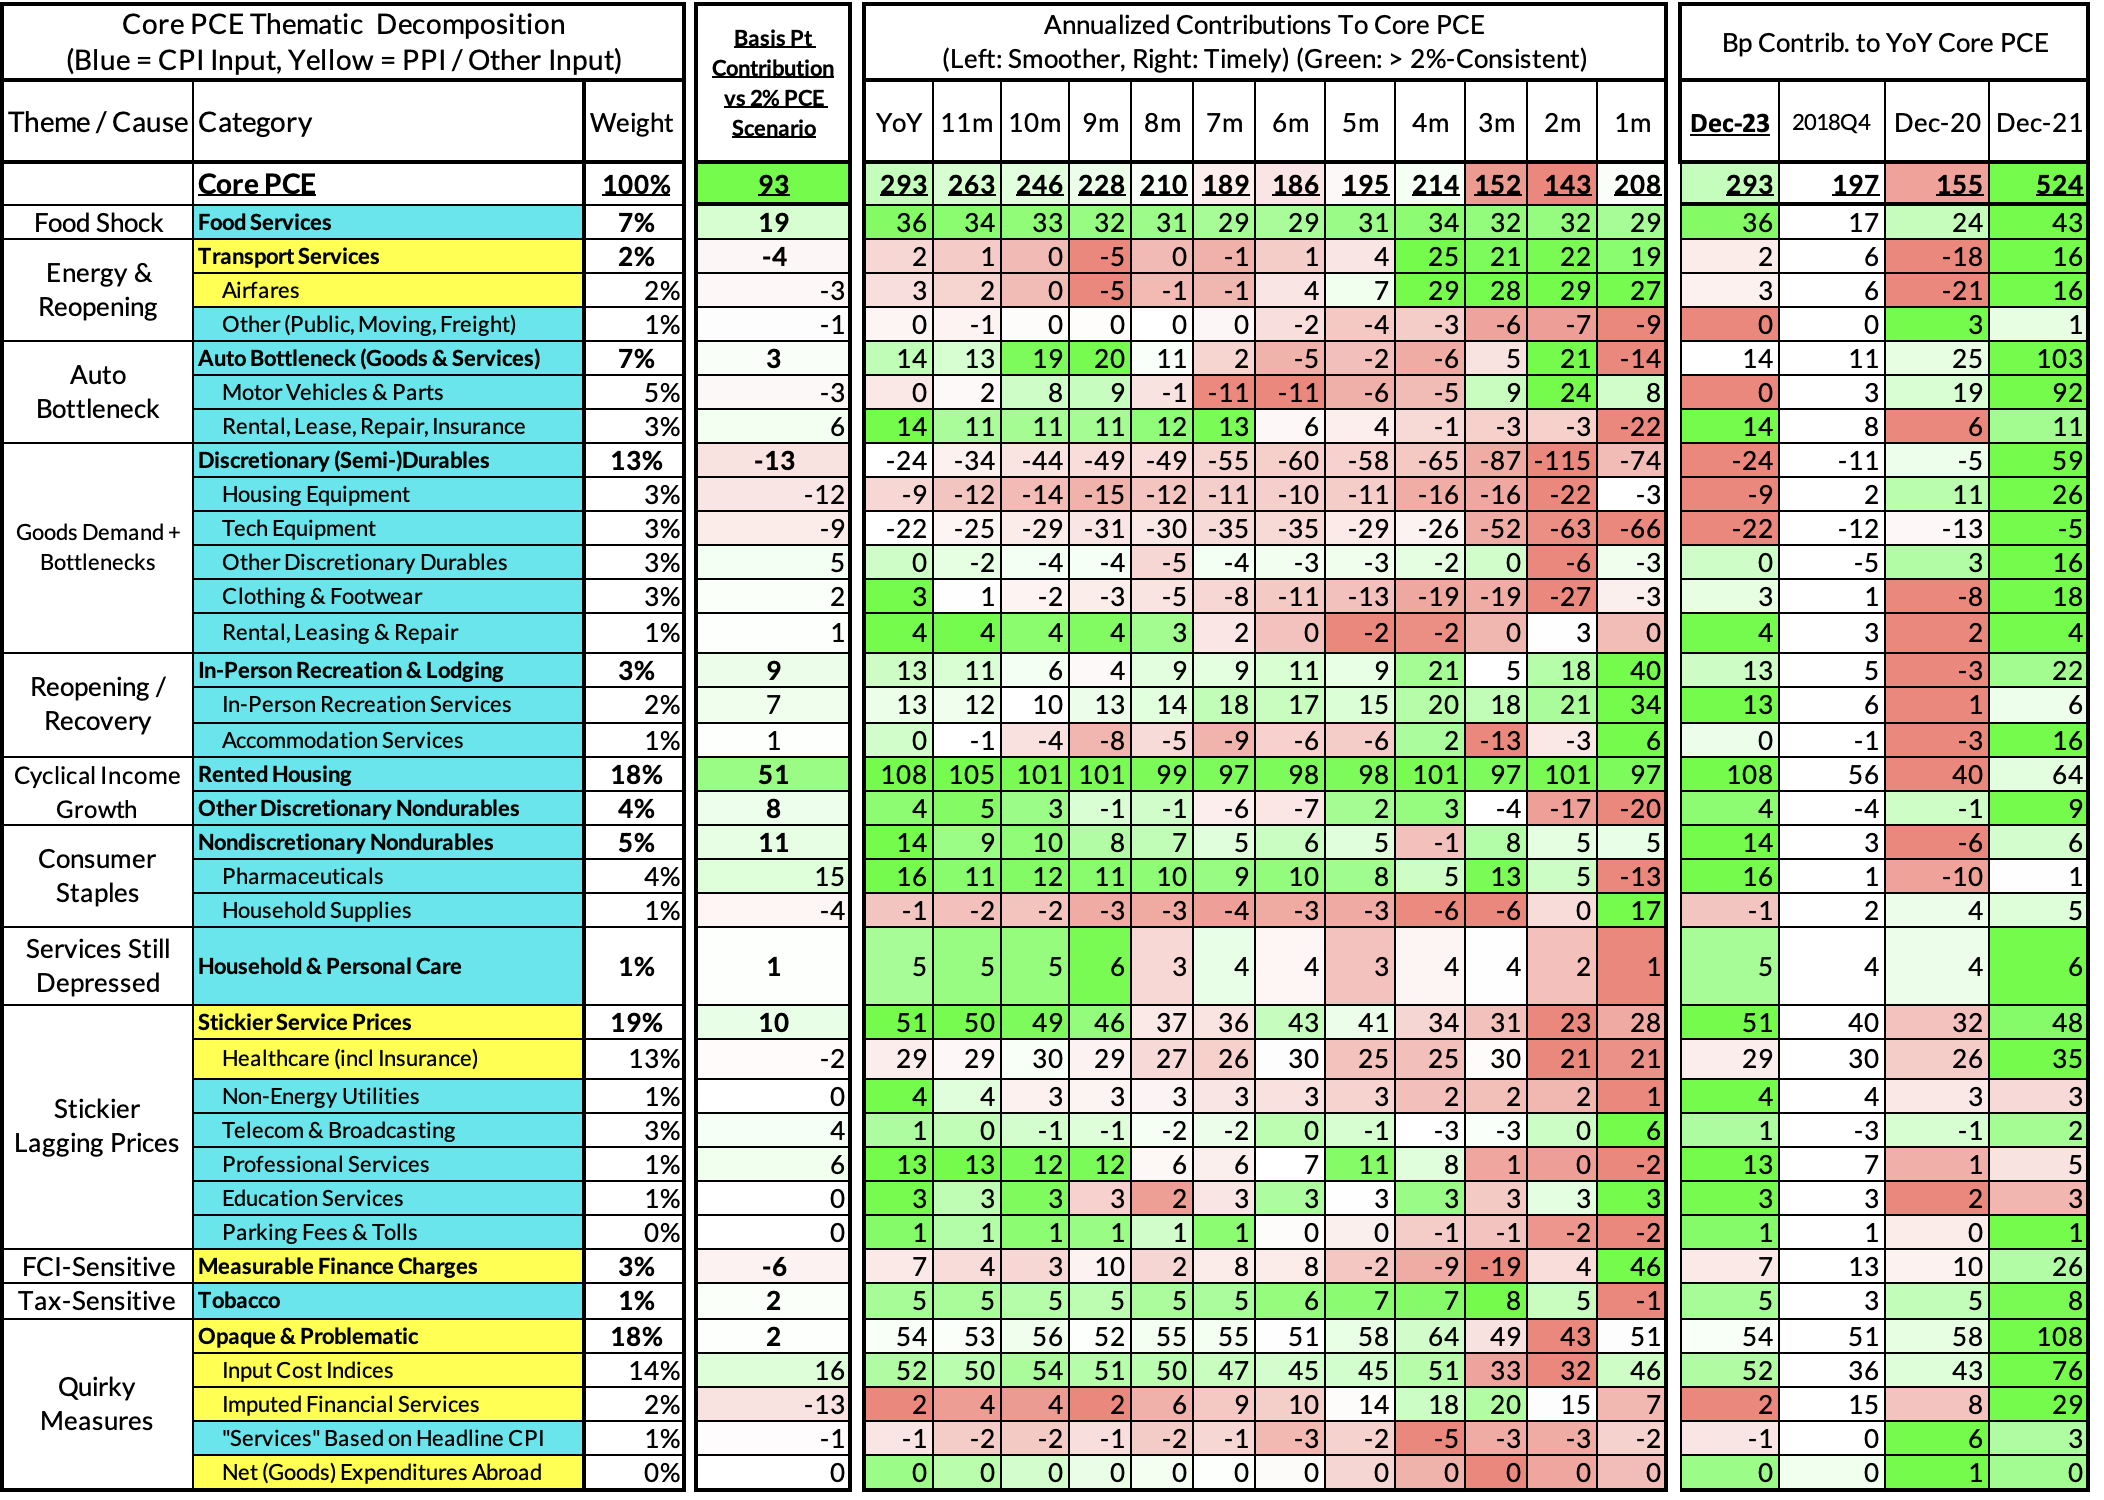
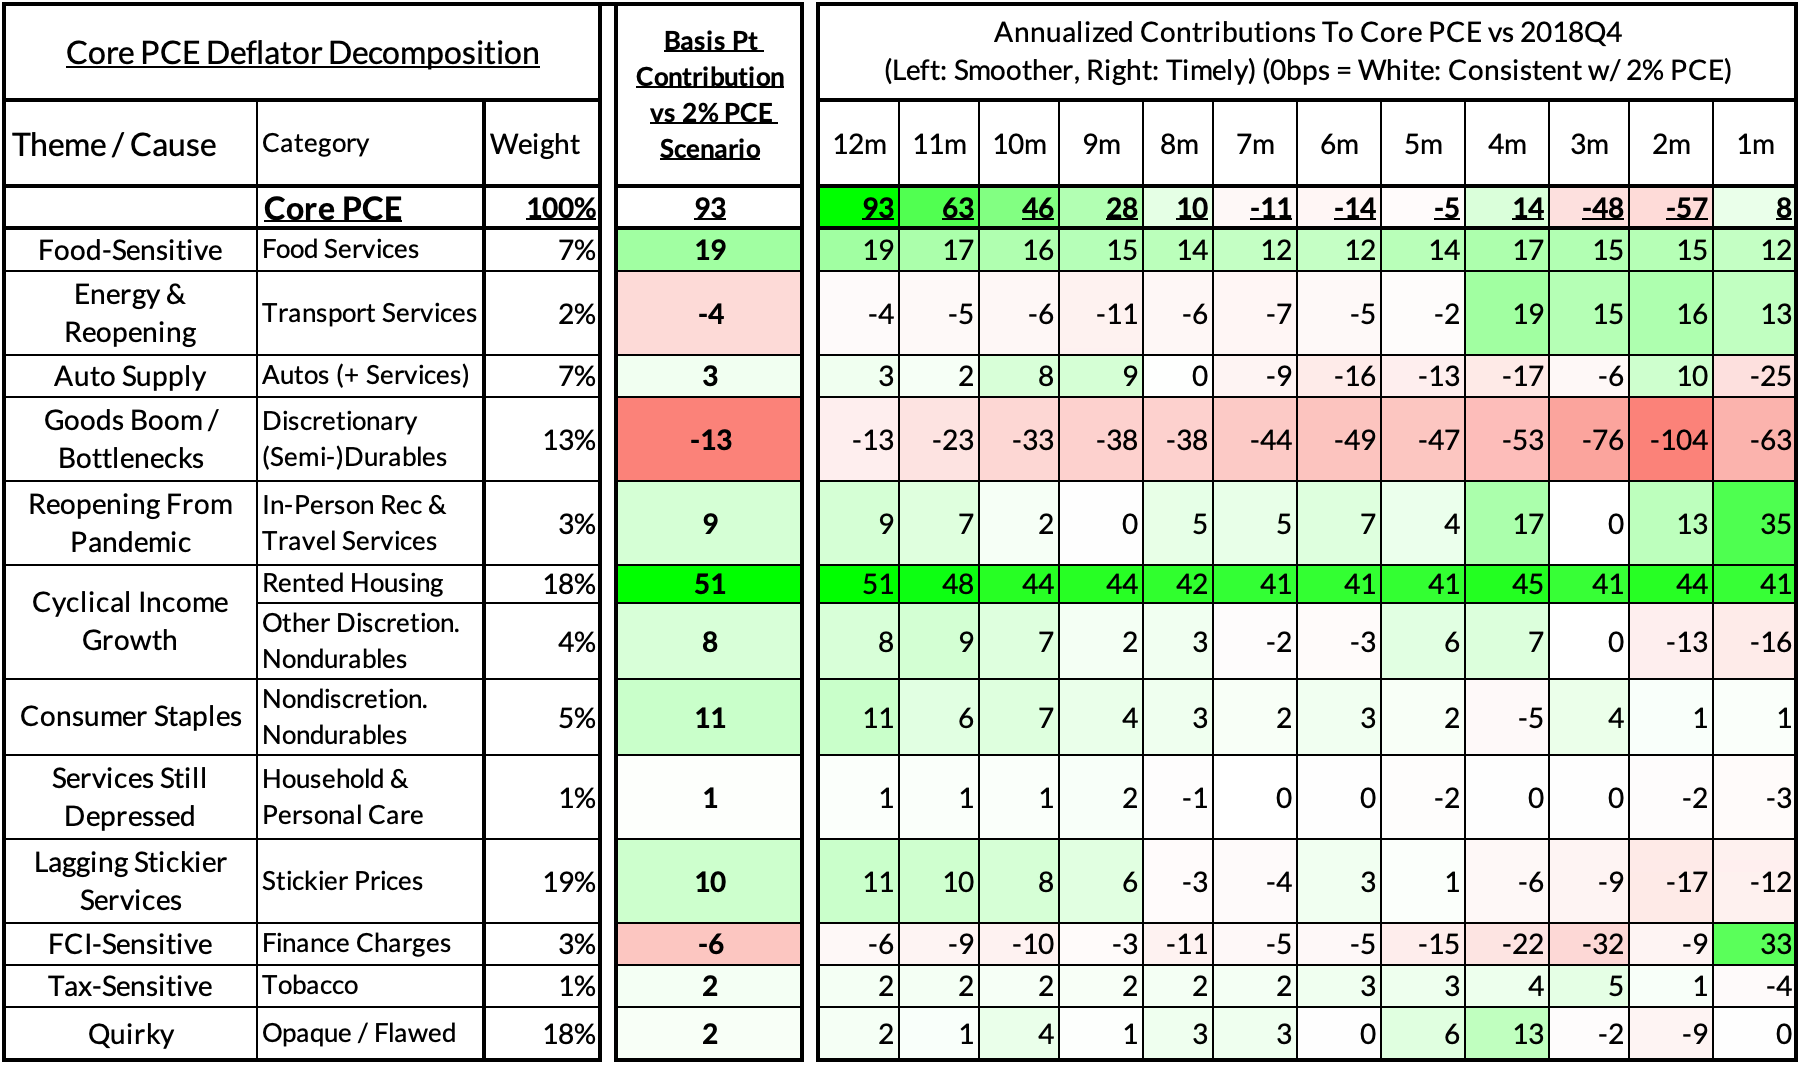
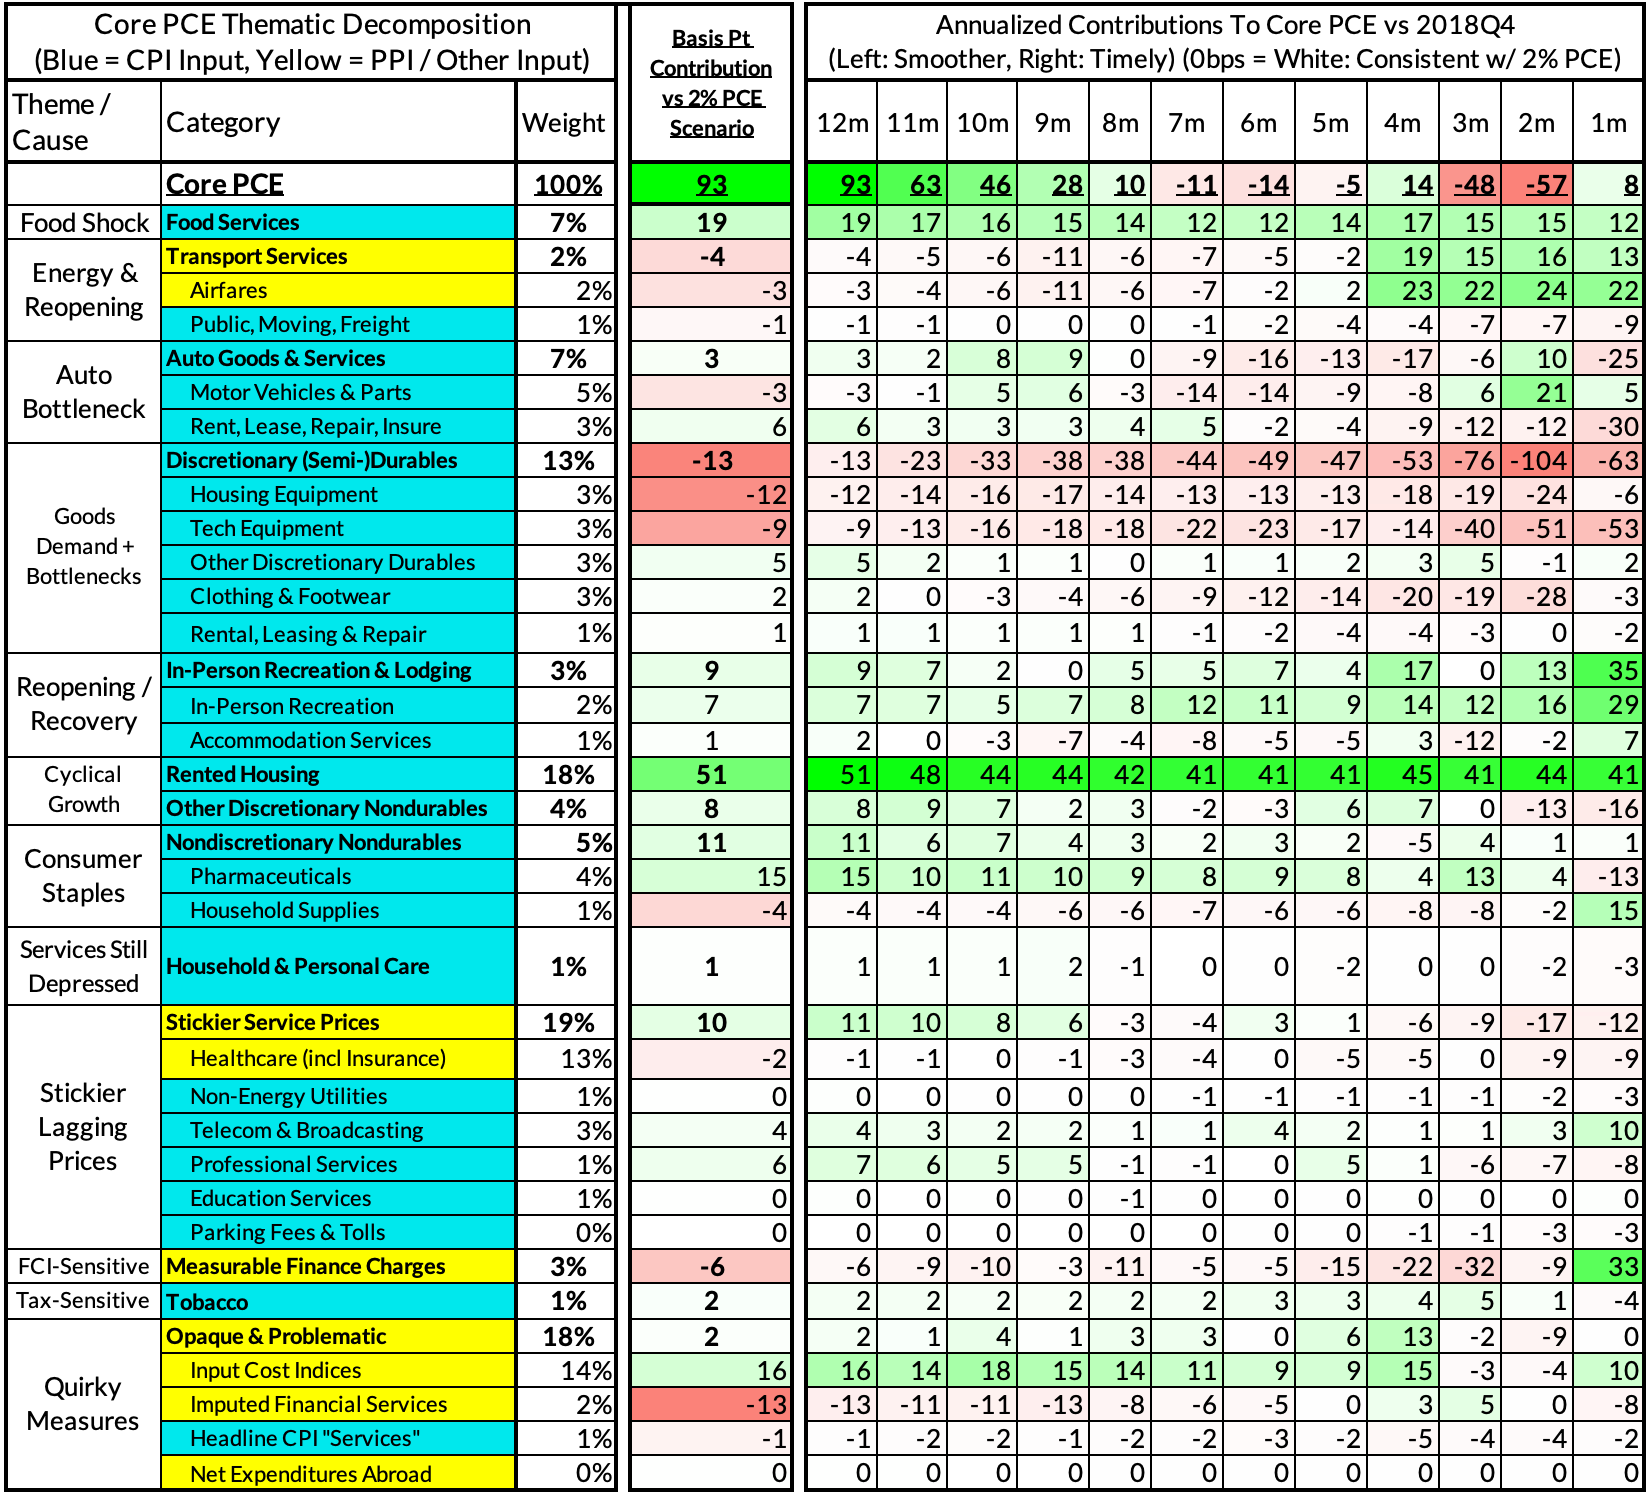
The final two heat maps below gives you a sense of the overshoot on shorter annualized run-rates. December monthly annualized core PCE yielded an 8 basis point overshoot vs 2% target inflation (2.08% annualized).
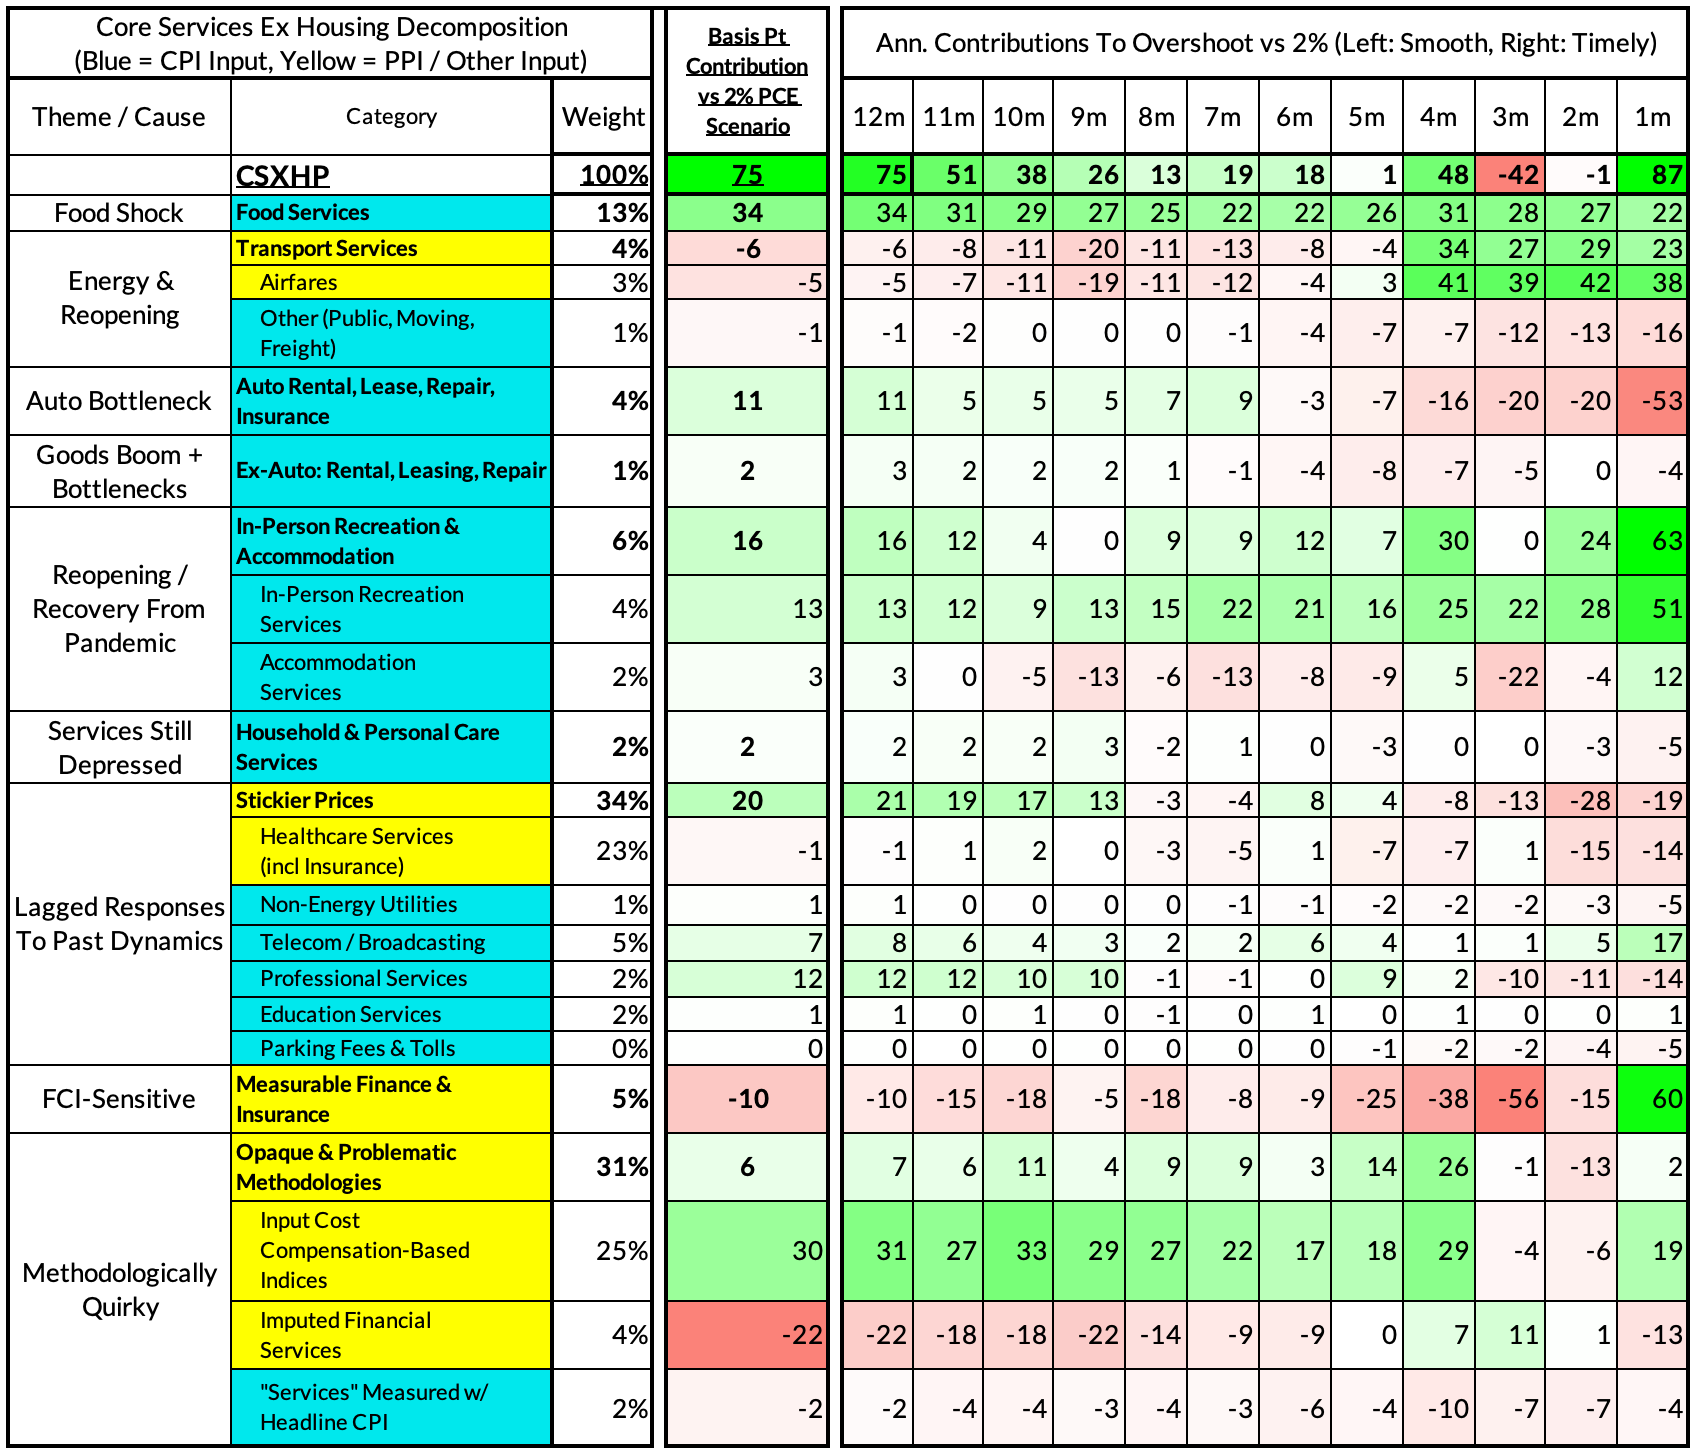
For the Detail-Oriented: Core Services Ex Housing PCE Heatmaps
The December growth rate in "Core Services Ex Housing" ('supercore') PCE ran at 3.34% year-over-year, a 75 basis point overshoot versus the ~2.59% run rate that coincided with ~2% headline and core PCE.
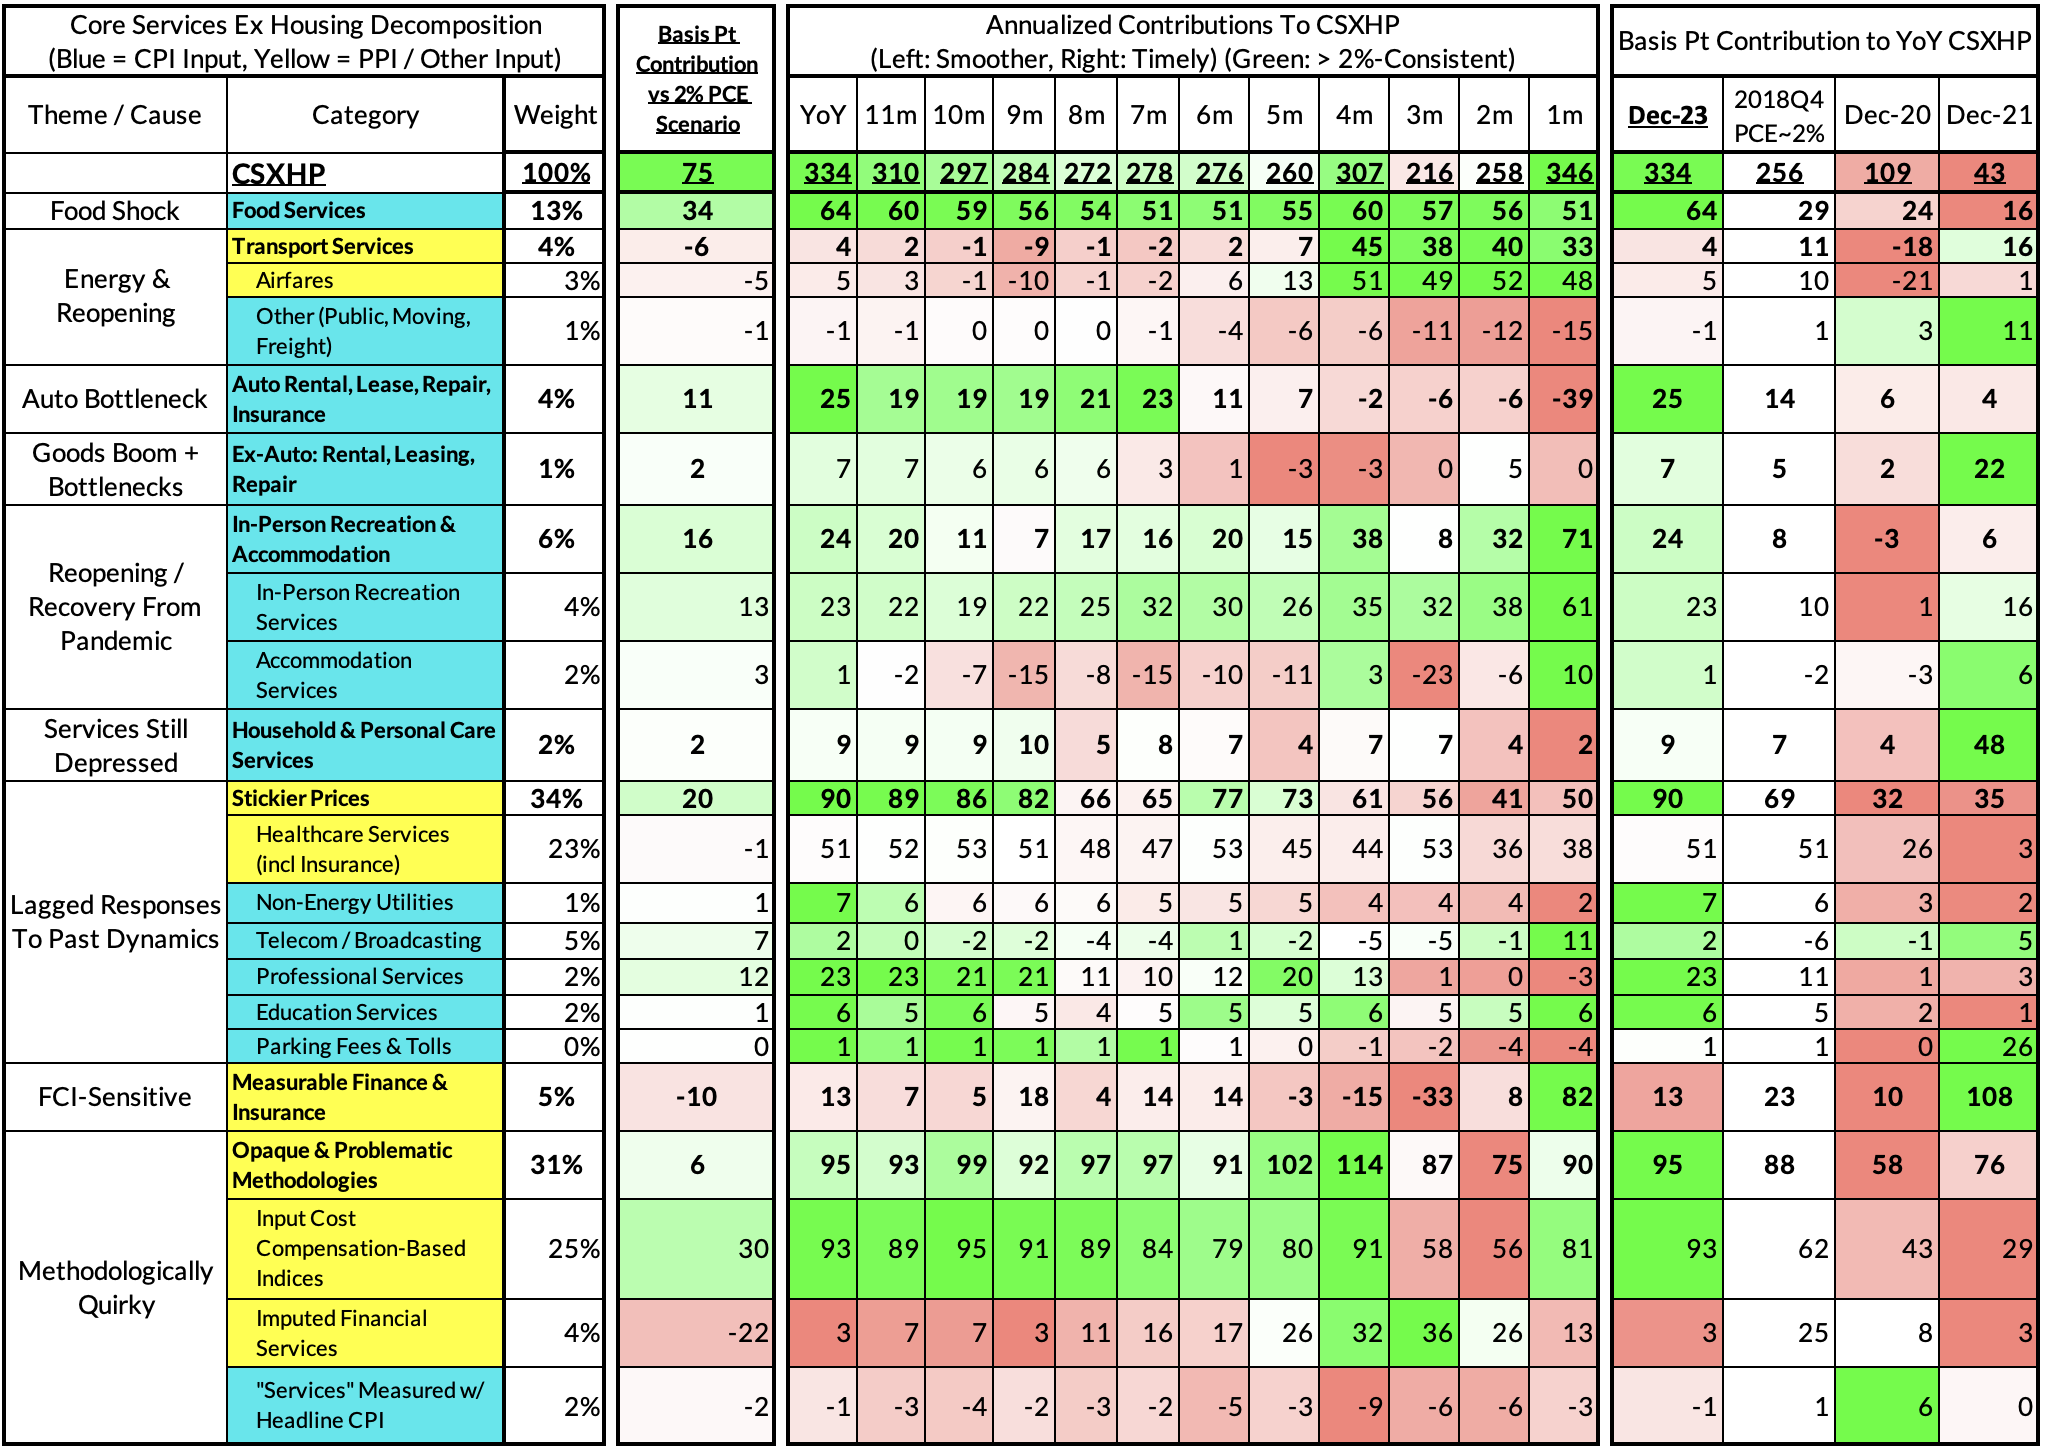
December monthly supercore ran at a 3.46% annualized rate, a 87 basis point overshoot of what would be consistent with 2% headline and core PCE.