October Core-Cast Post-PCE: The Good News Keeps Coming In And Accelerates The Potential Timeline For Cuts

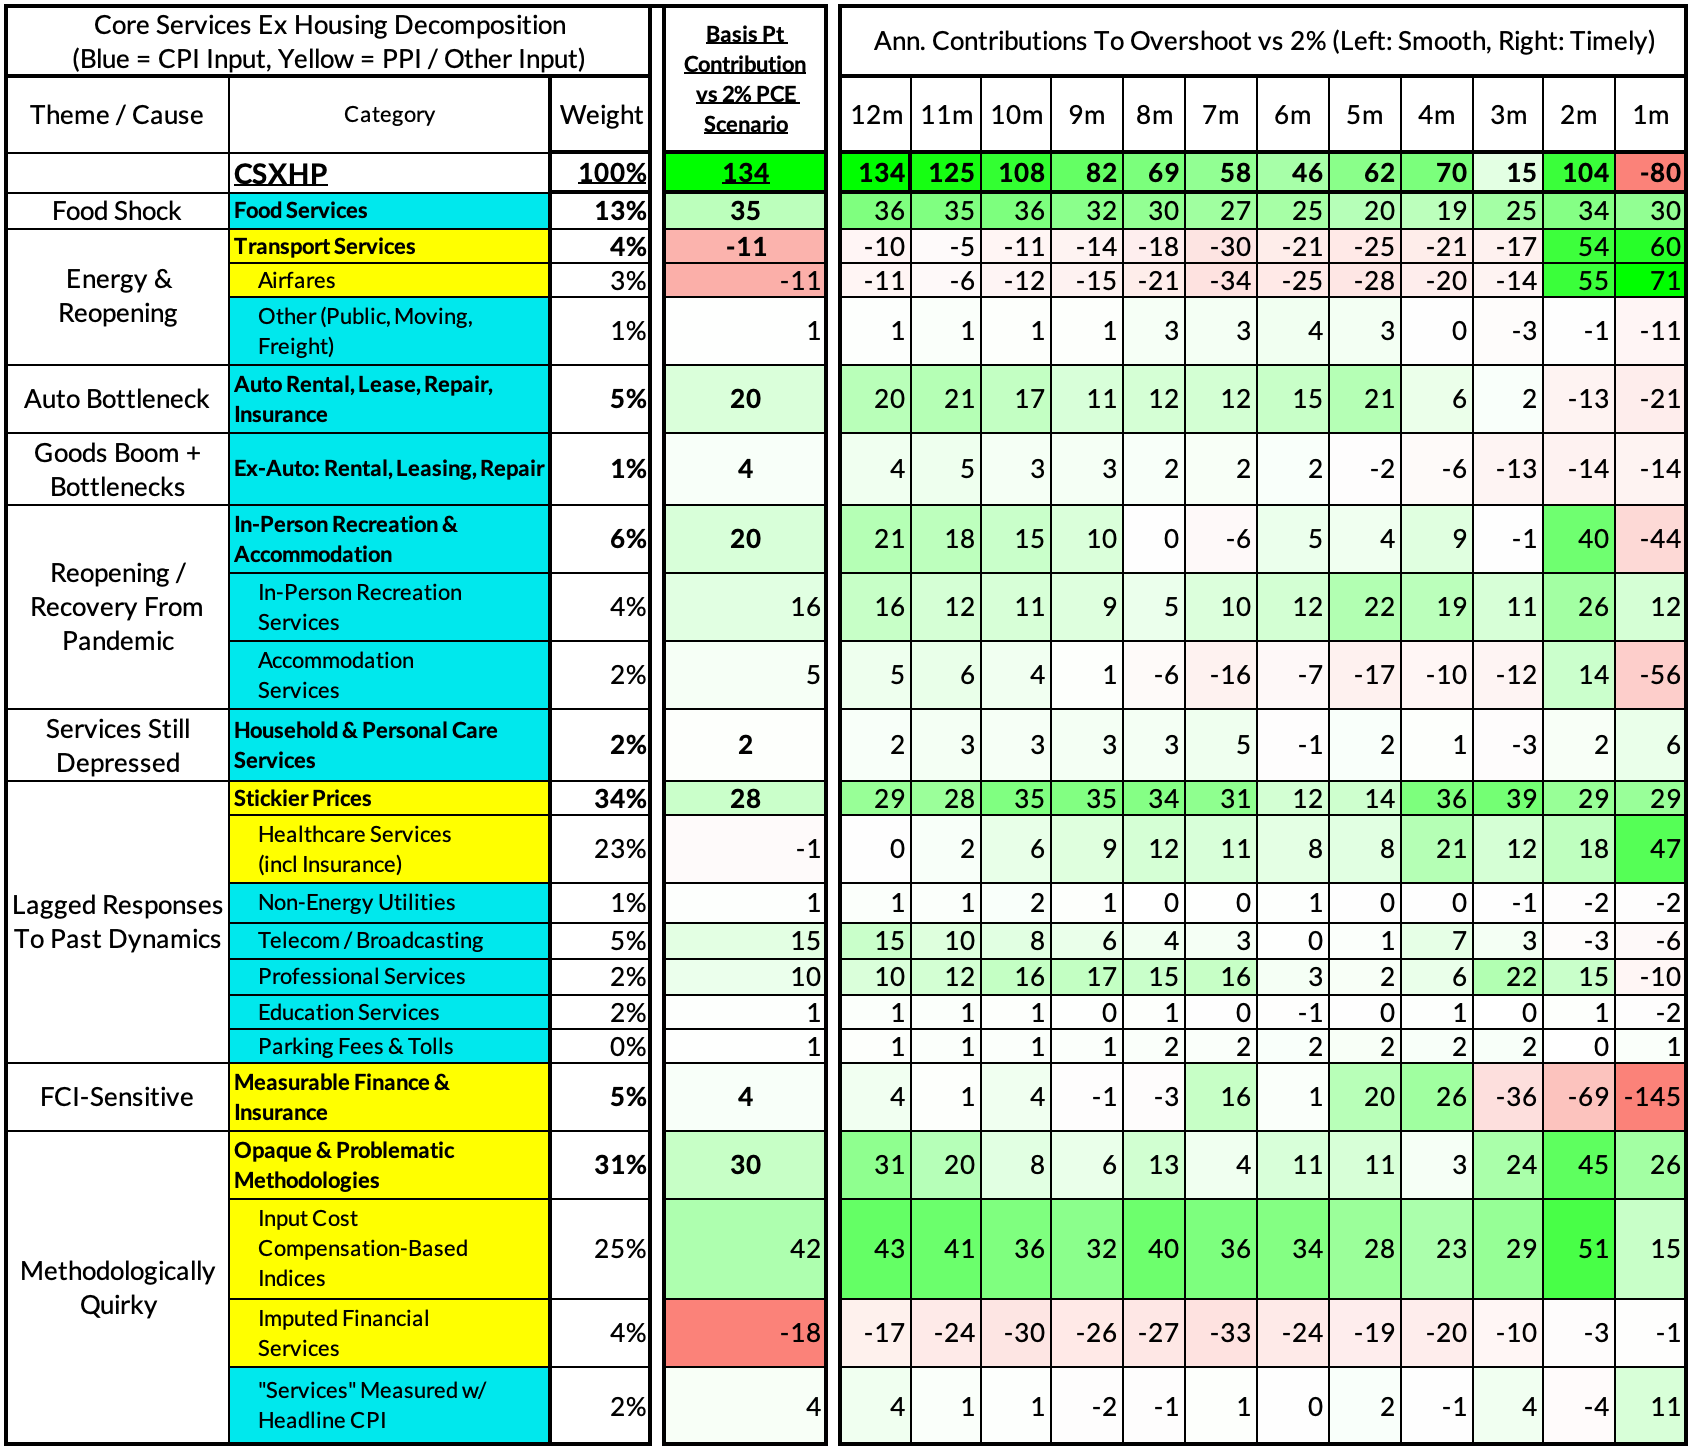
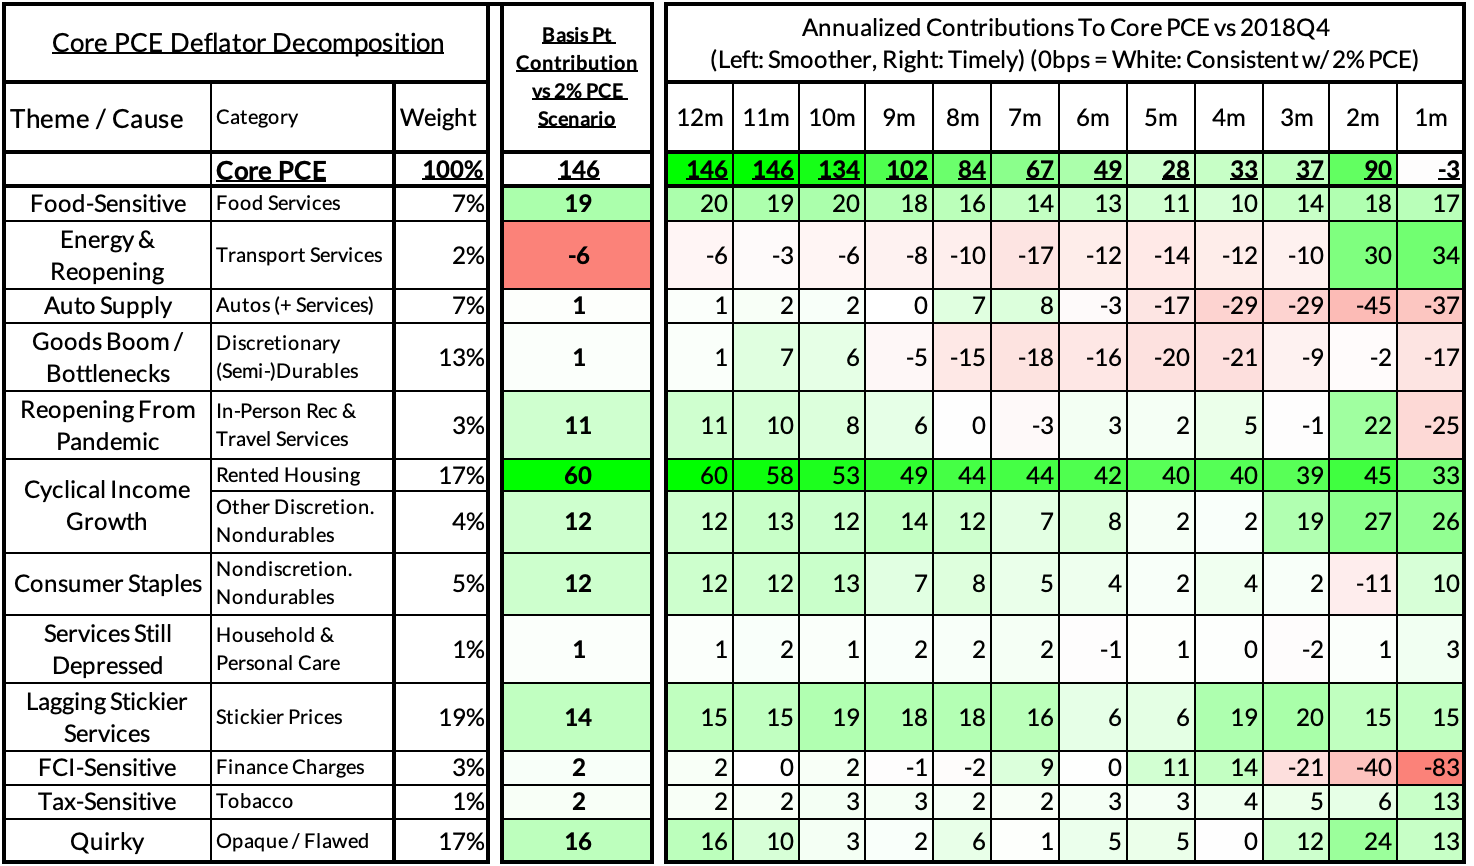
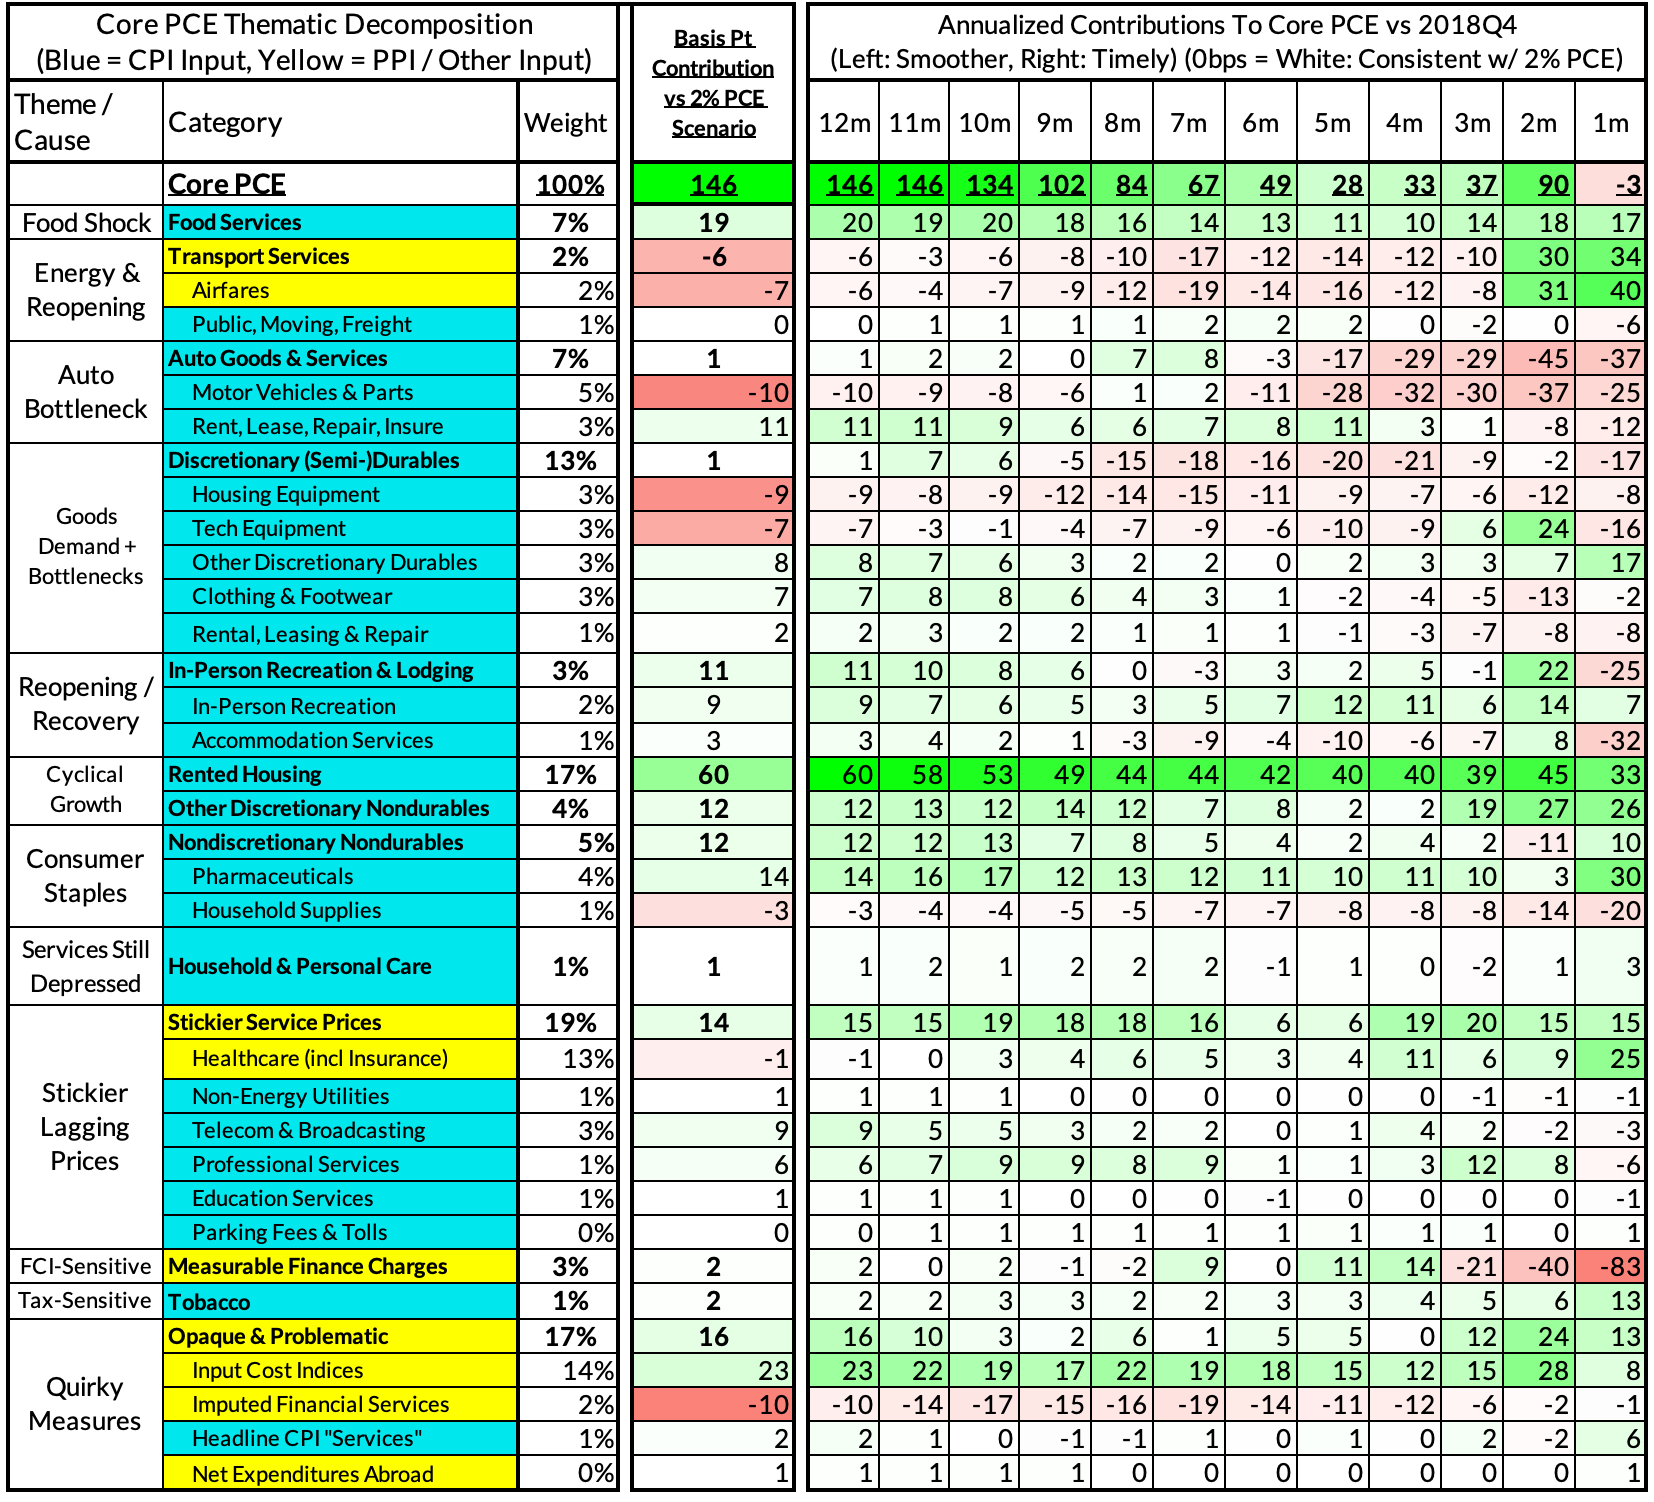
Core-Cast is our nowcasting model to track the Fed's preferred inflation gauges before and through their release date. The heatmaps below give a comprehensive view of how inflation components and themes are performing relative to what transpires when inflation is running at 2%.
Most of the Personal Consumption Expenditures (PCE) inflation gauges are sourced from Consumer Price Index (CPI) data, but Producer Price Index (PPI) input data is of increasing relevance, import price index (IPI) data can prove occasionally relevant. There are also some high-leverage components that only come out on the day of the PCE release. Reach out to us if you would like to become a Premium Donor to support and access all of our research content.
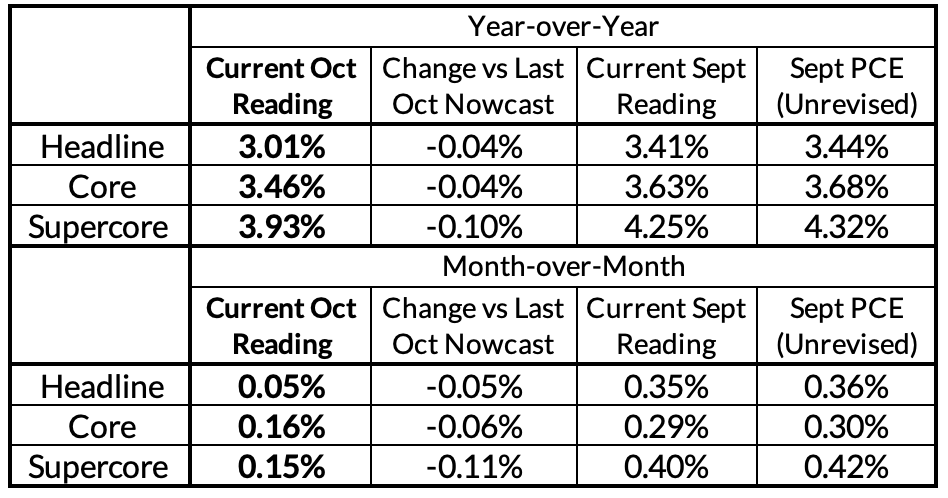
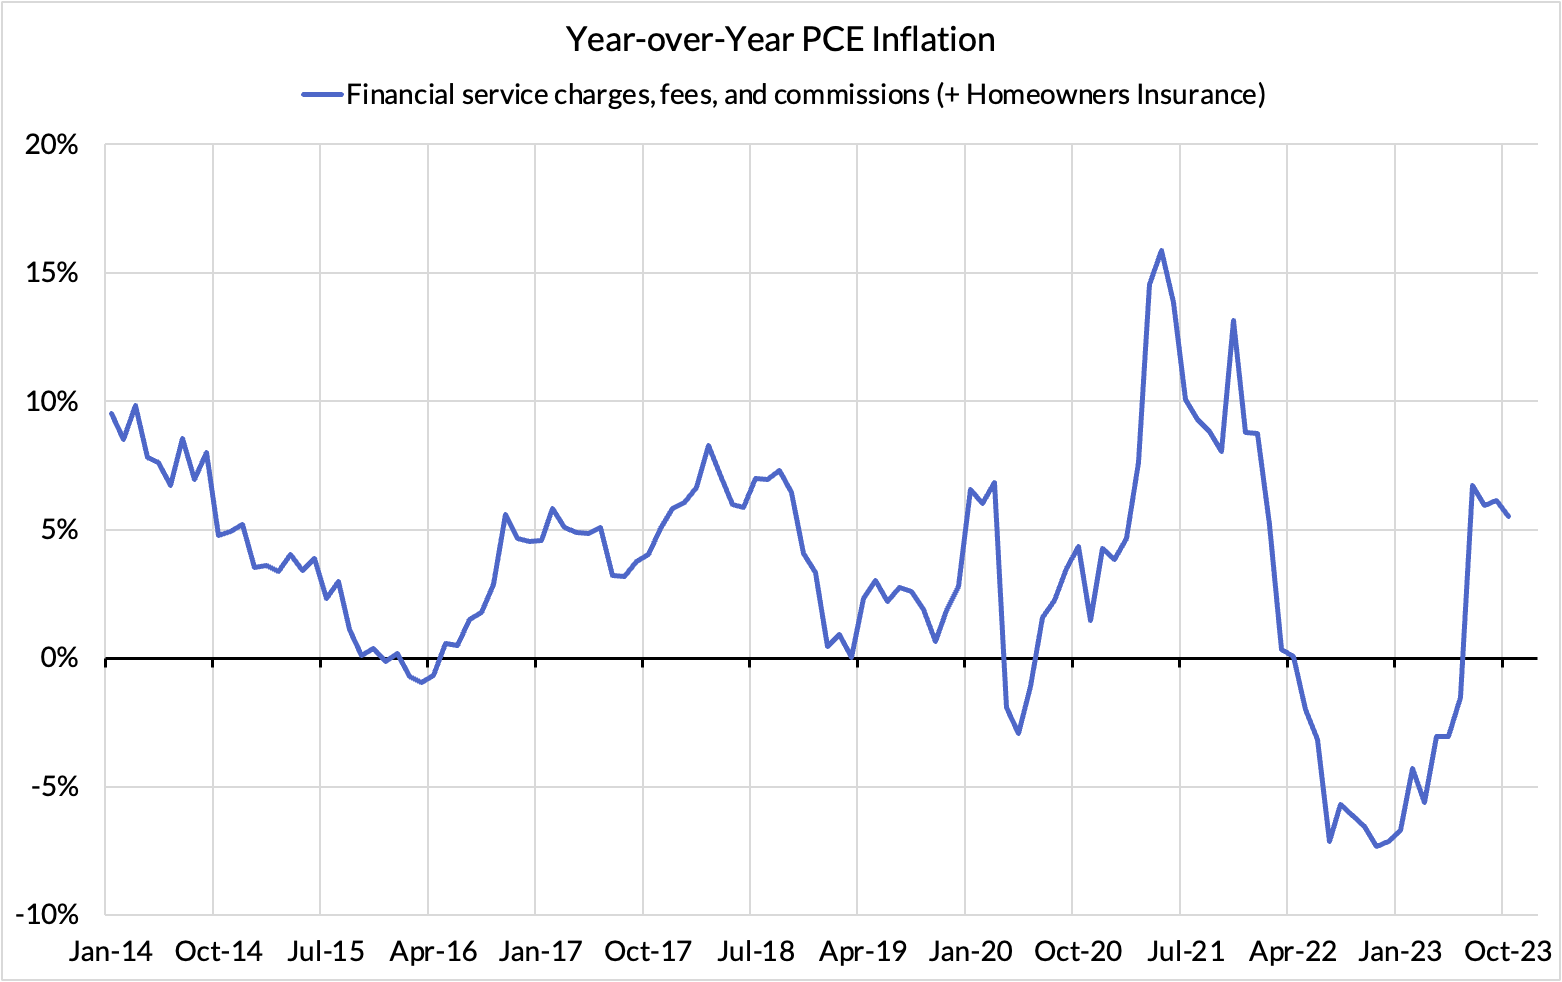
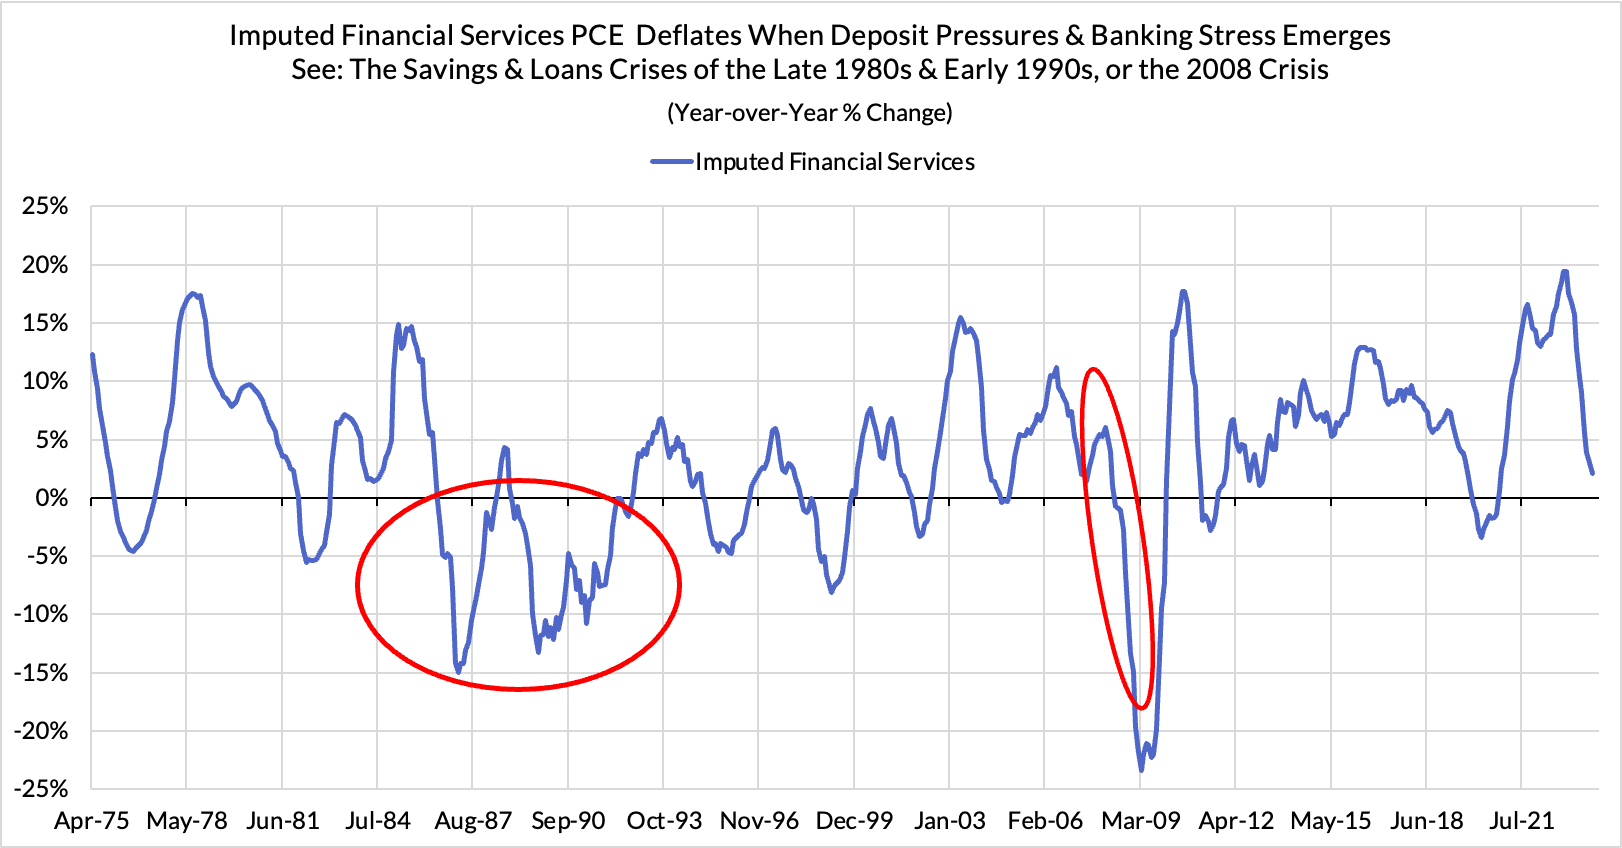
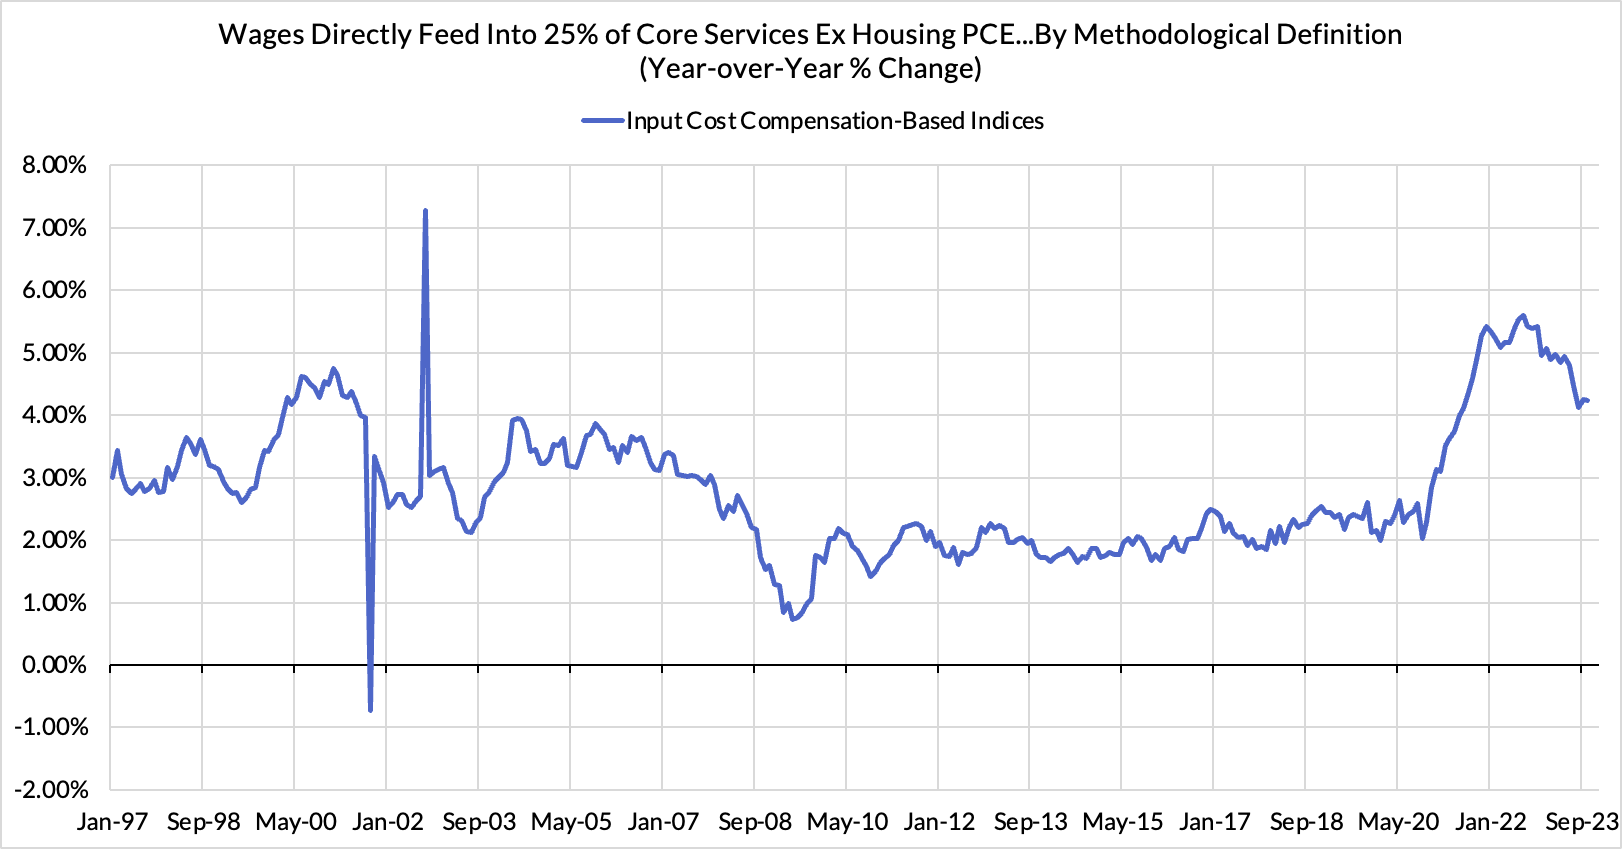
We received even more welcome news about the disinflationary pace today after some very surprising and welcome downside revisions showed up yesterday. The segments of core PCE most vulnerable to revision (professional, financial, and transportation services) or else the "darkest" for us to nowcast (input cost indices, imputed financial services) showed more favorable signs today. While we saw some direct evidence of upside revision in Q3, that proved to be a more limited phenomenon and independent sources of revision surprised to the downside yesterday.
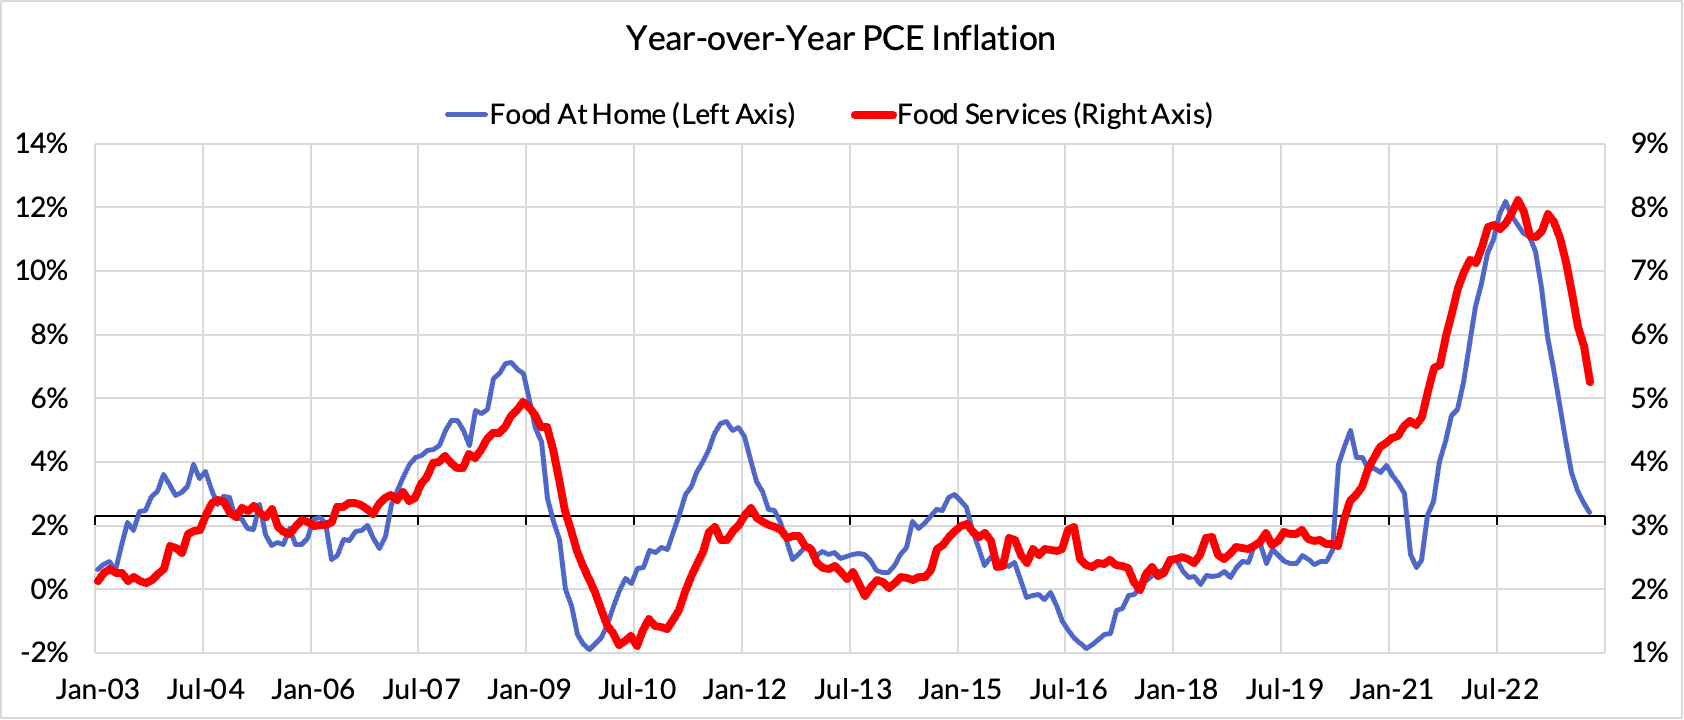
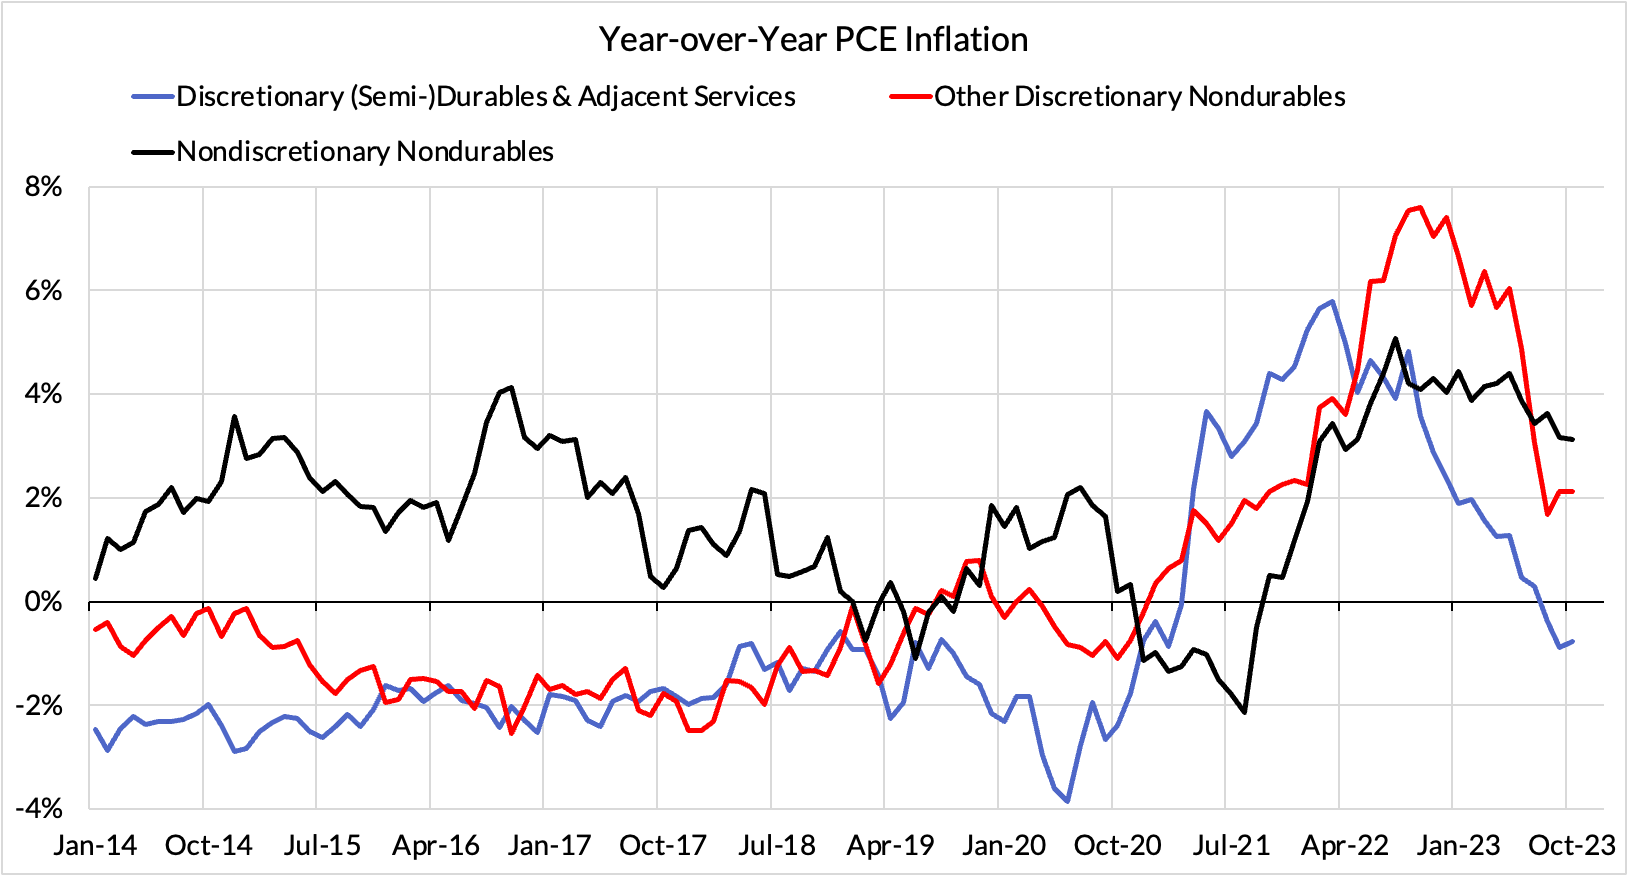
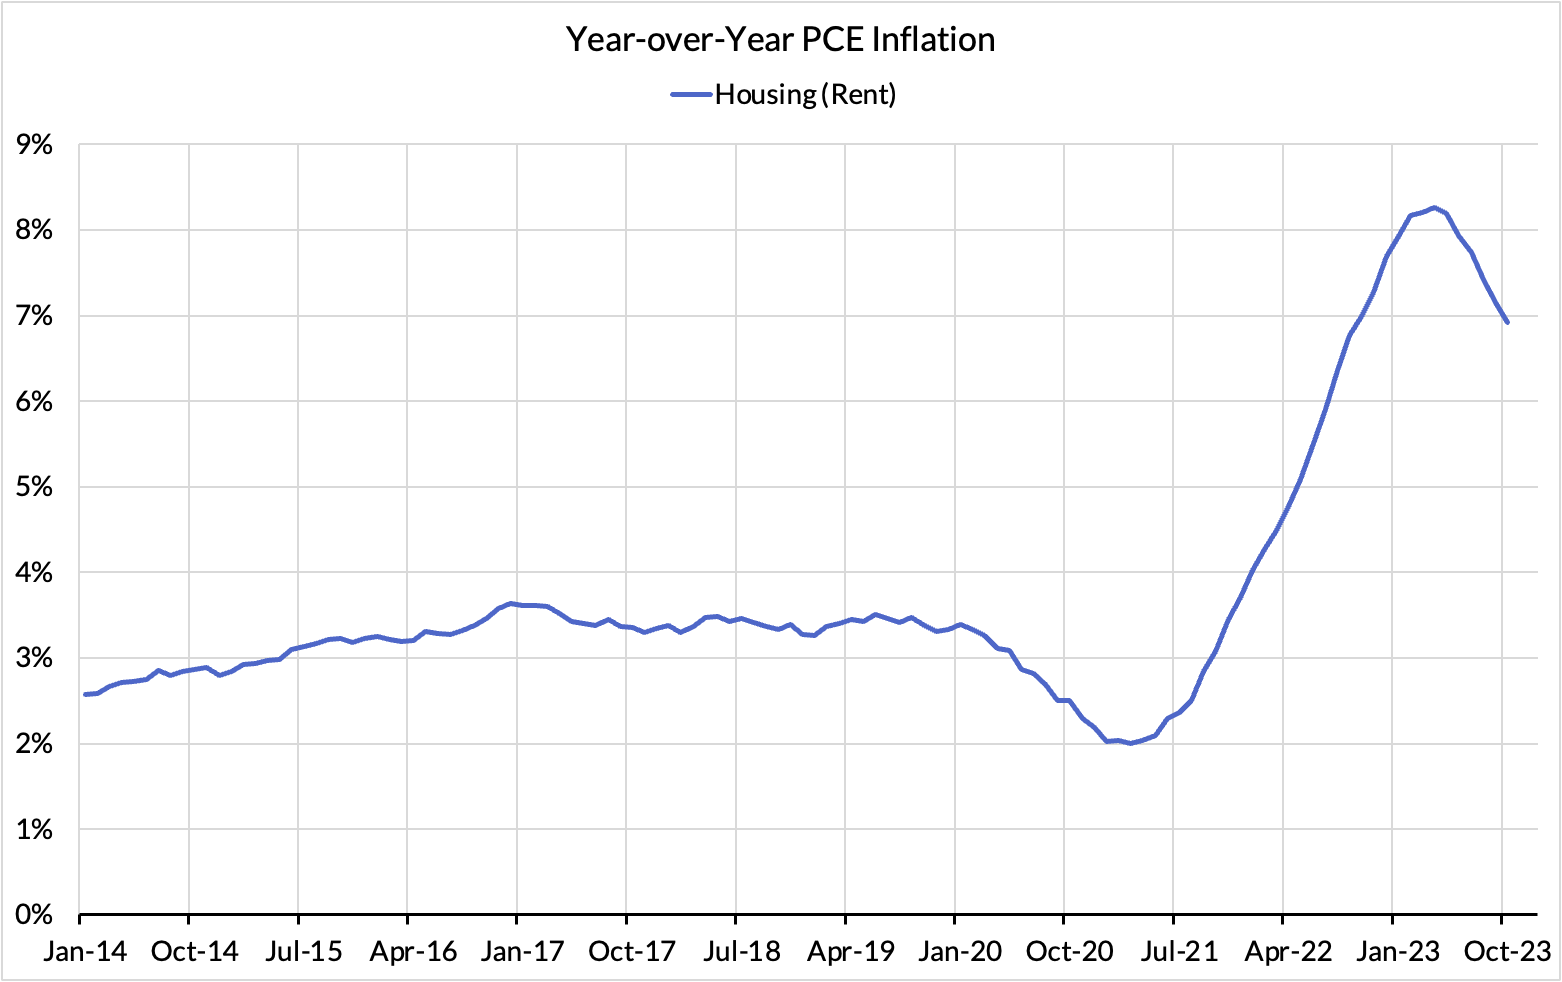
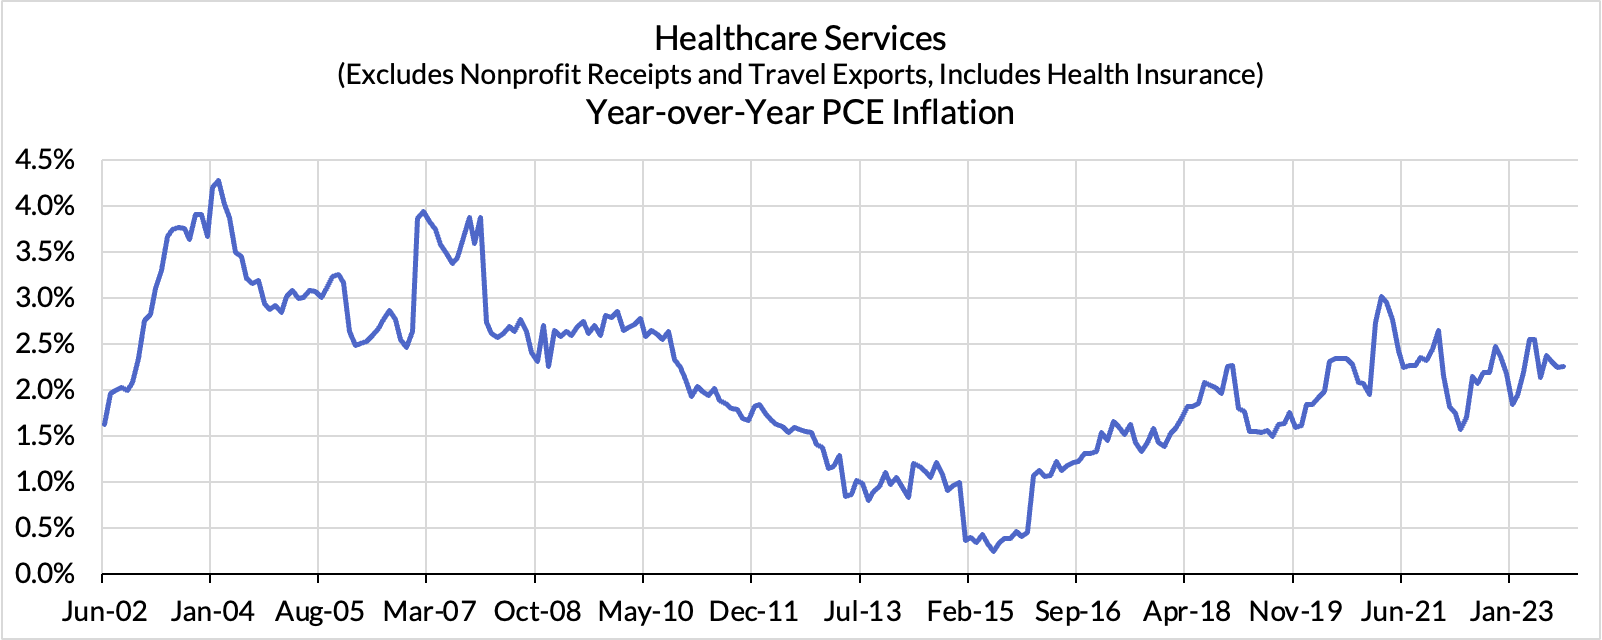
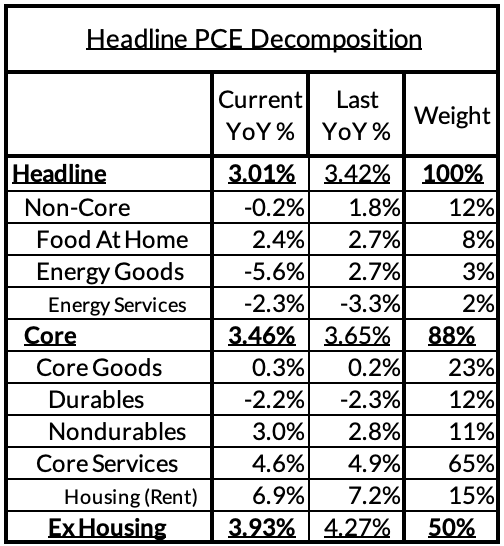
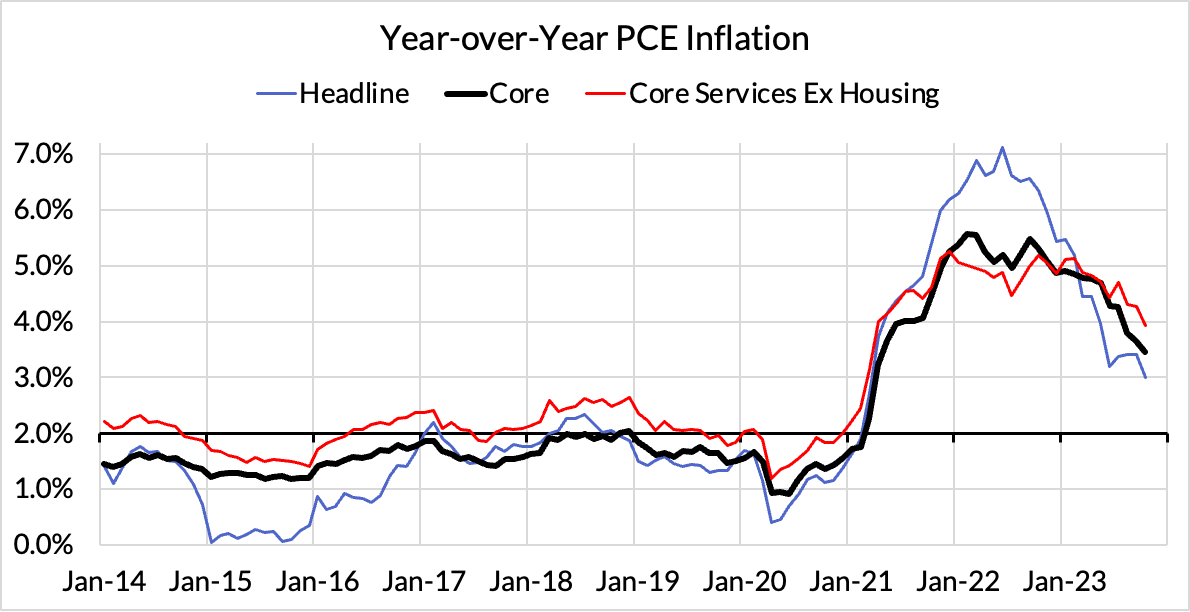
Right now Core PCE (PCE less food products and energy) is running at a 3.46% year-over-year pace as of October, 146 basis points above the Fed's 2% inflation target for PCE. That overshoot is disproportionately driven by catch-up rent CPI inflation in response to the surge in household formation (a byproduct of rapidly recovering job growth), which caused market rents to surge in 2021. Rent is contributing 60 basis points to the 146 basis point core PCE overshoot.
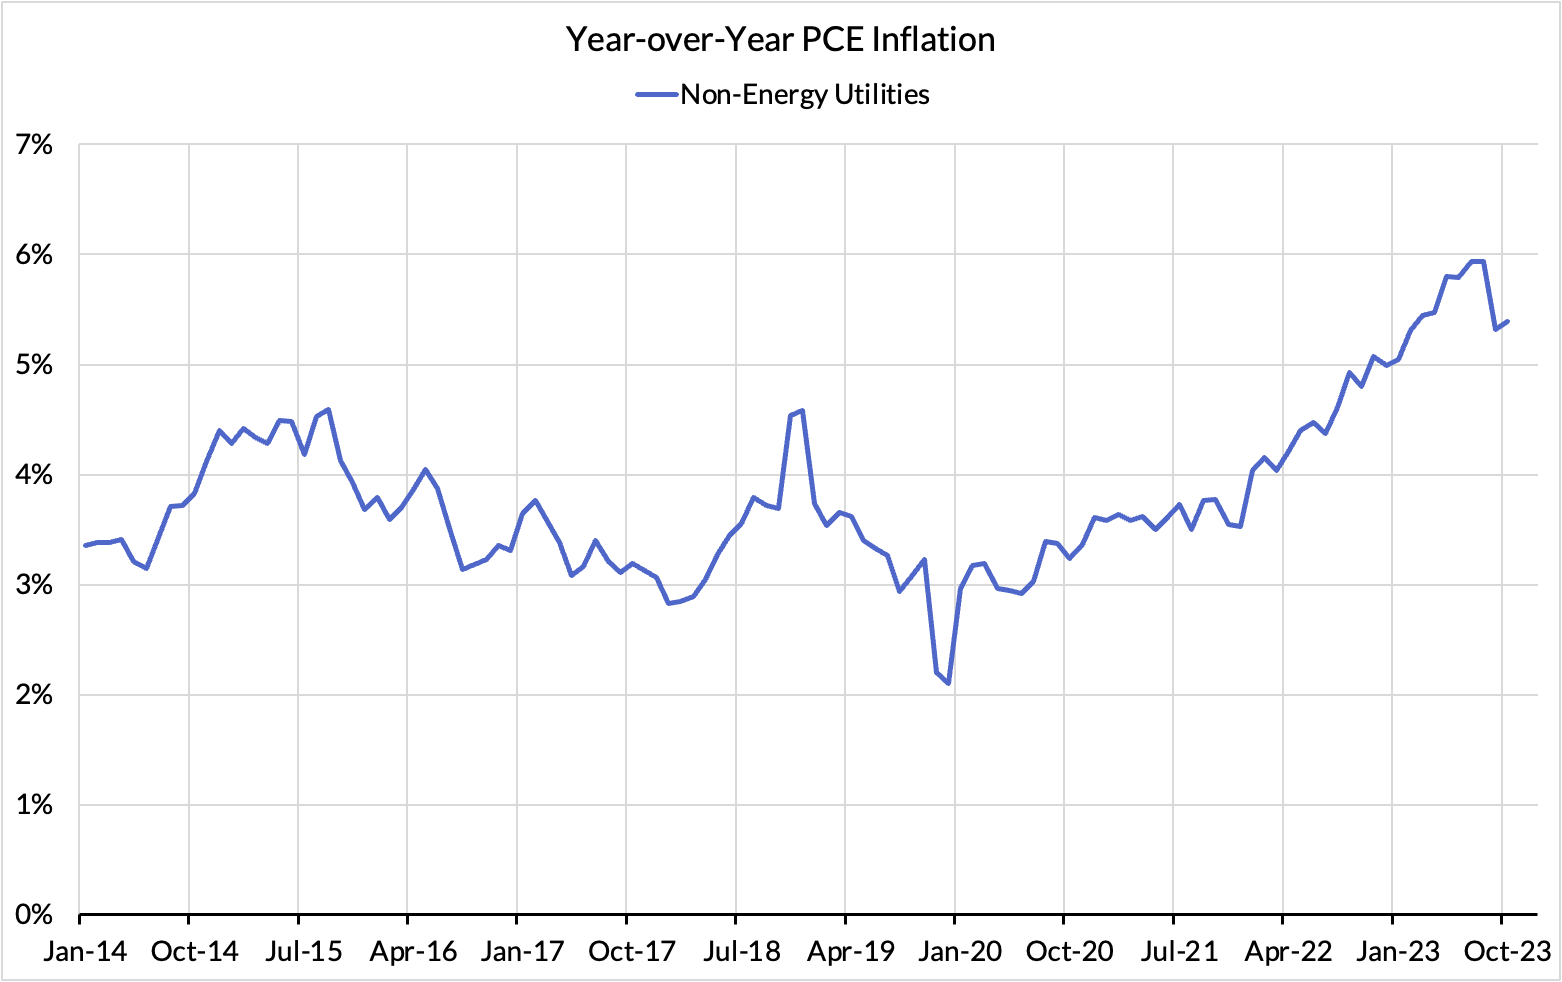
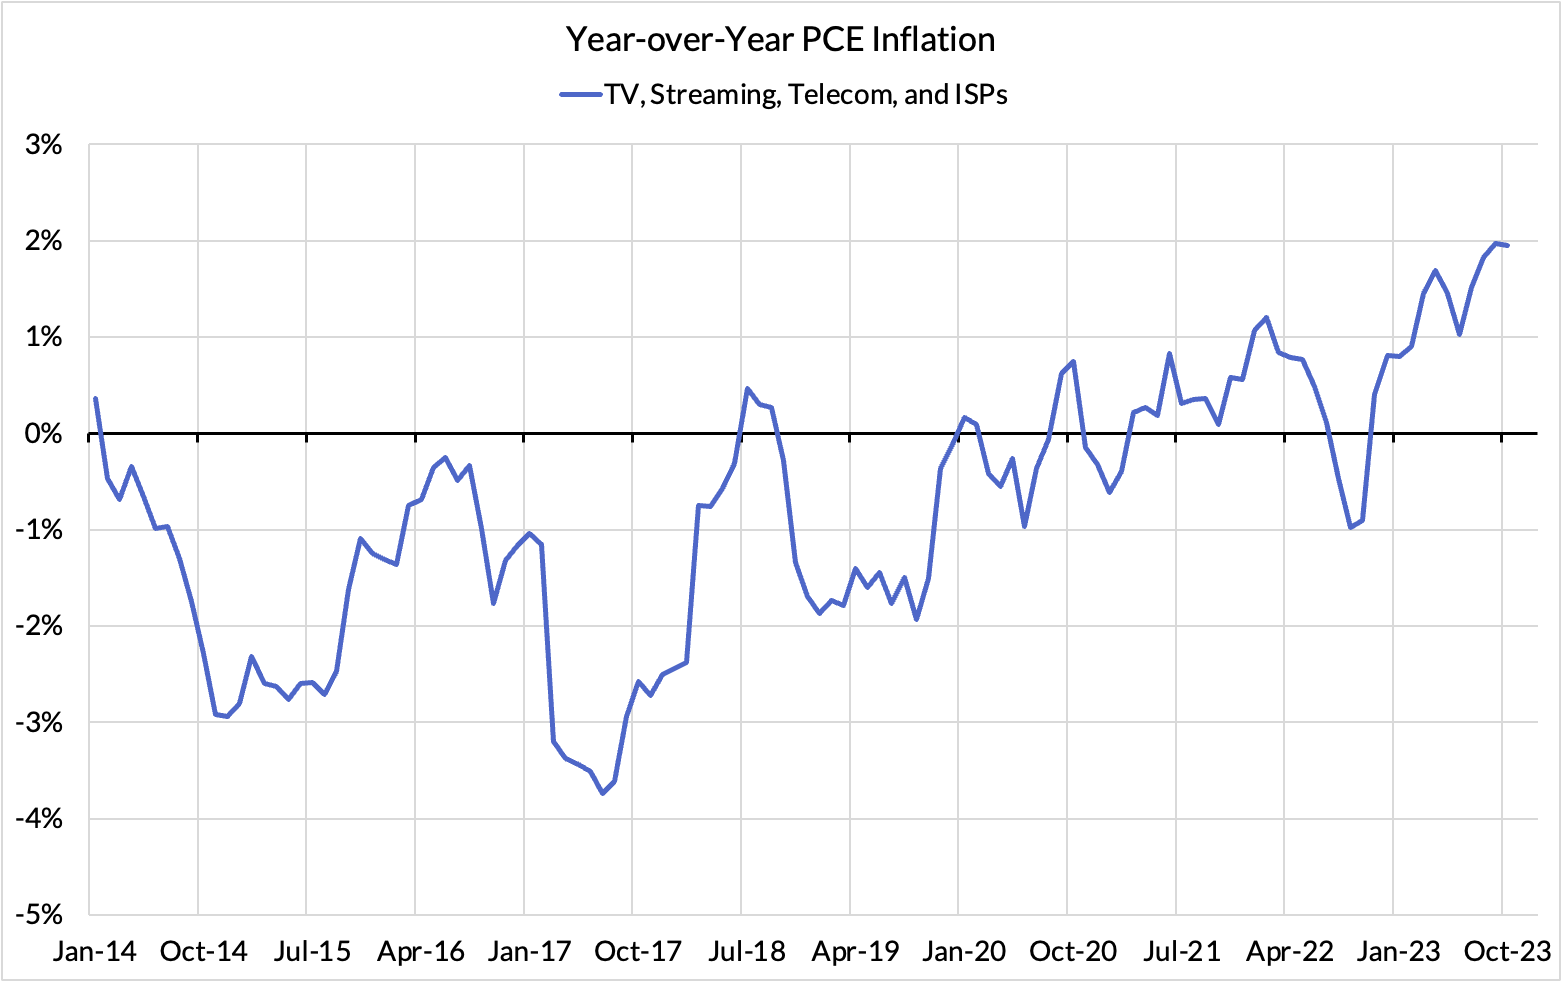
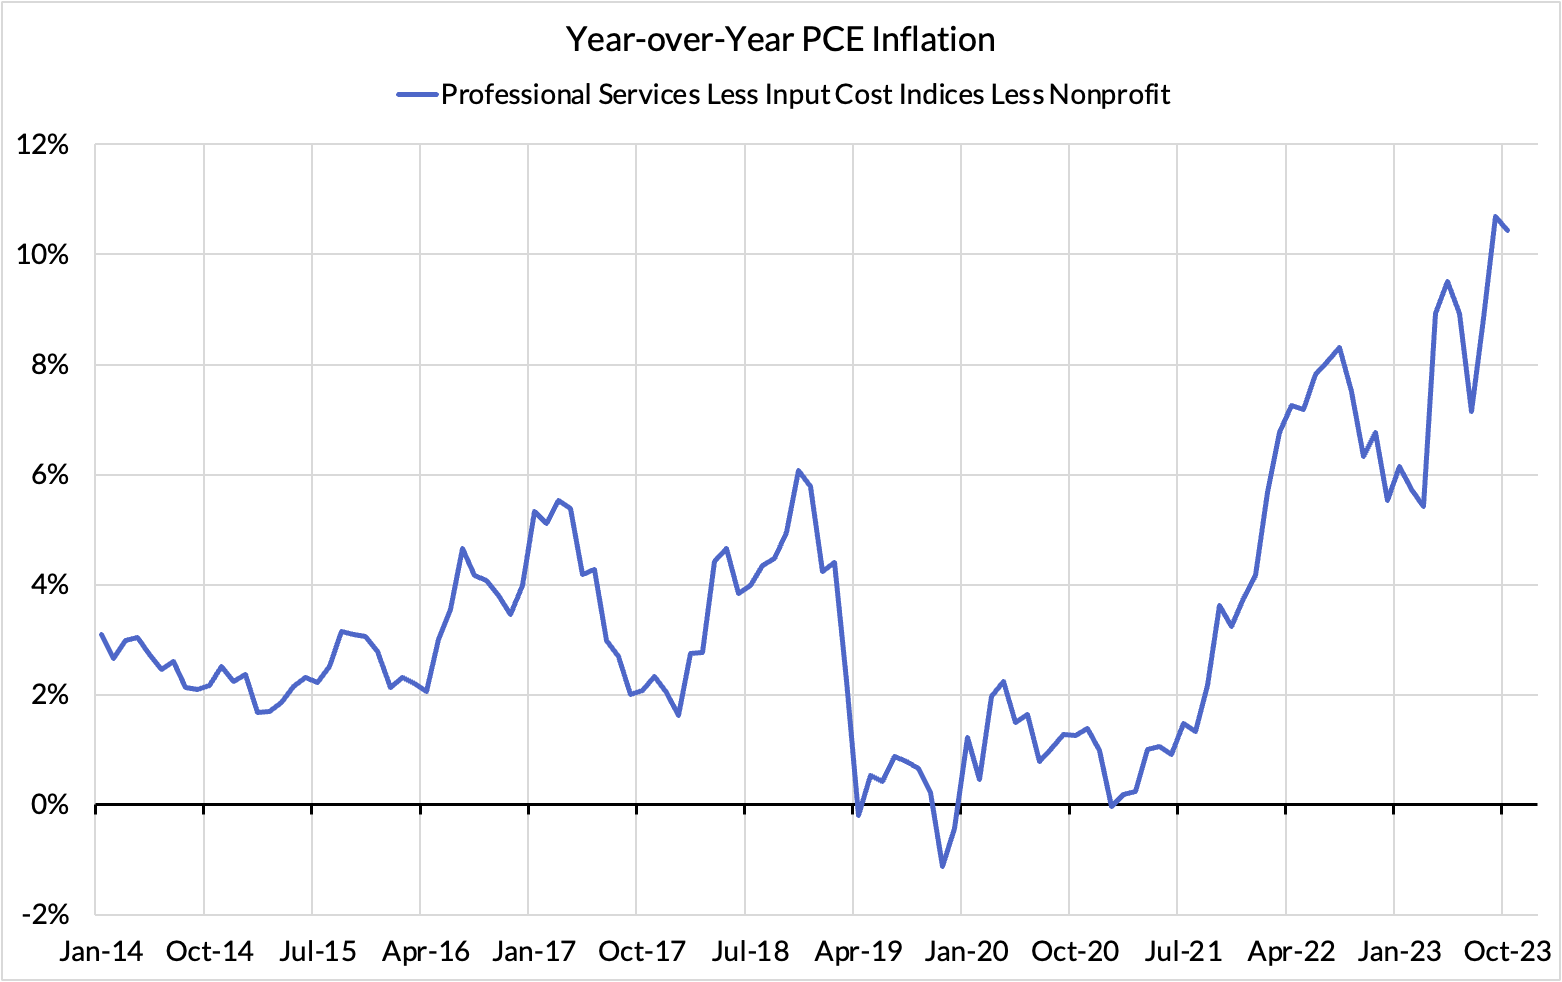
There are other contributors to the overshoot:
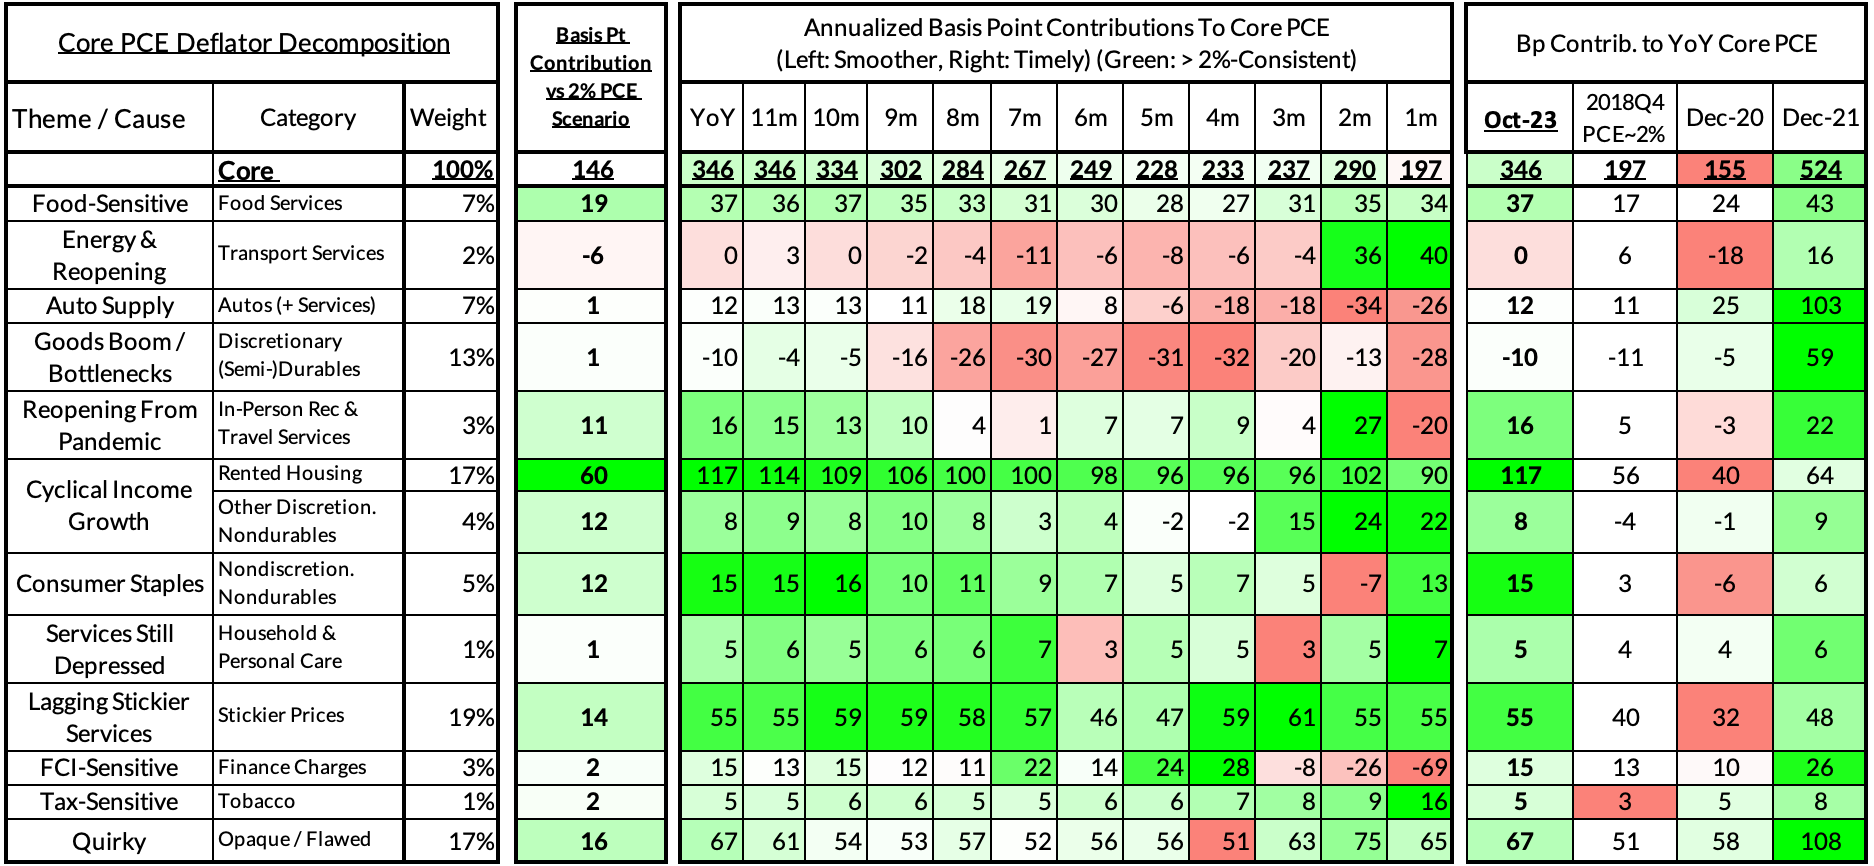
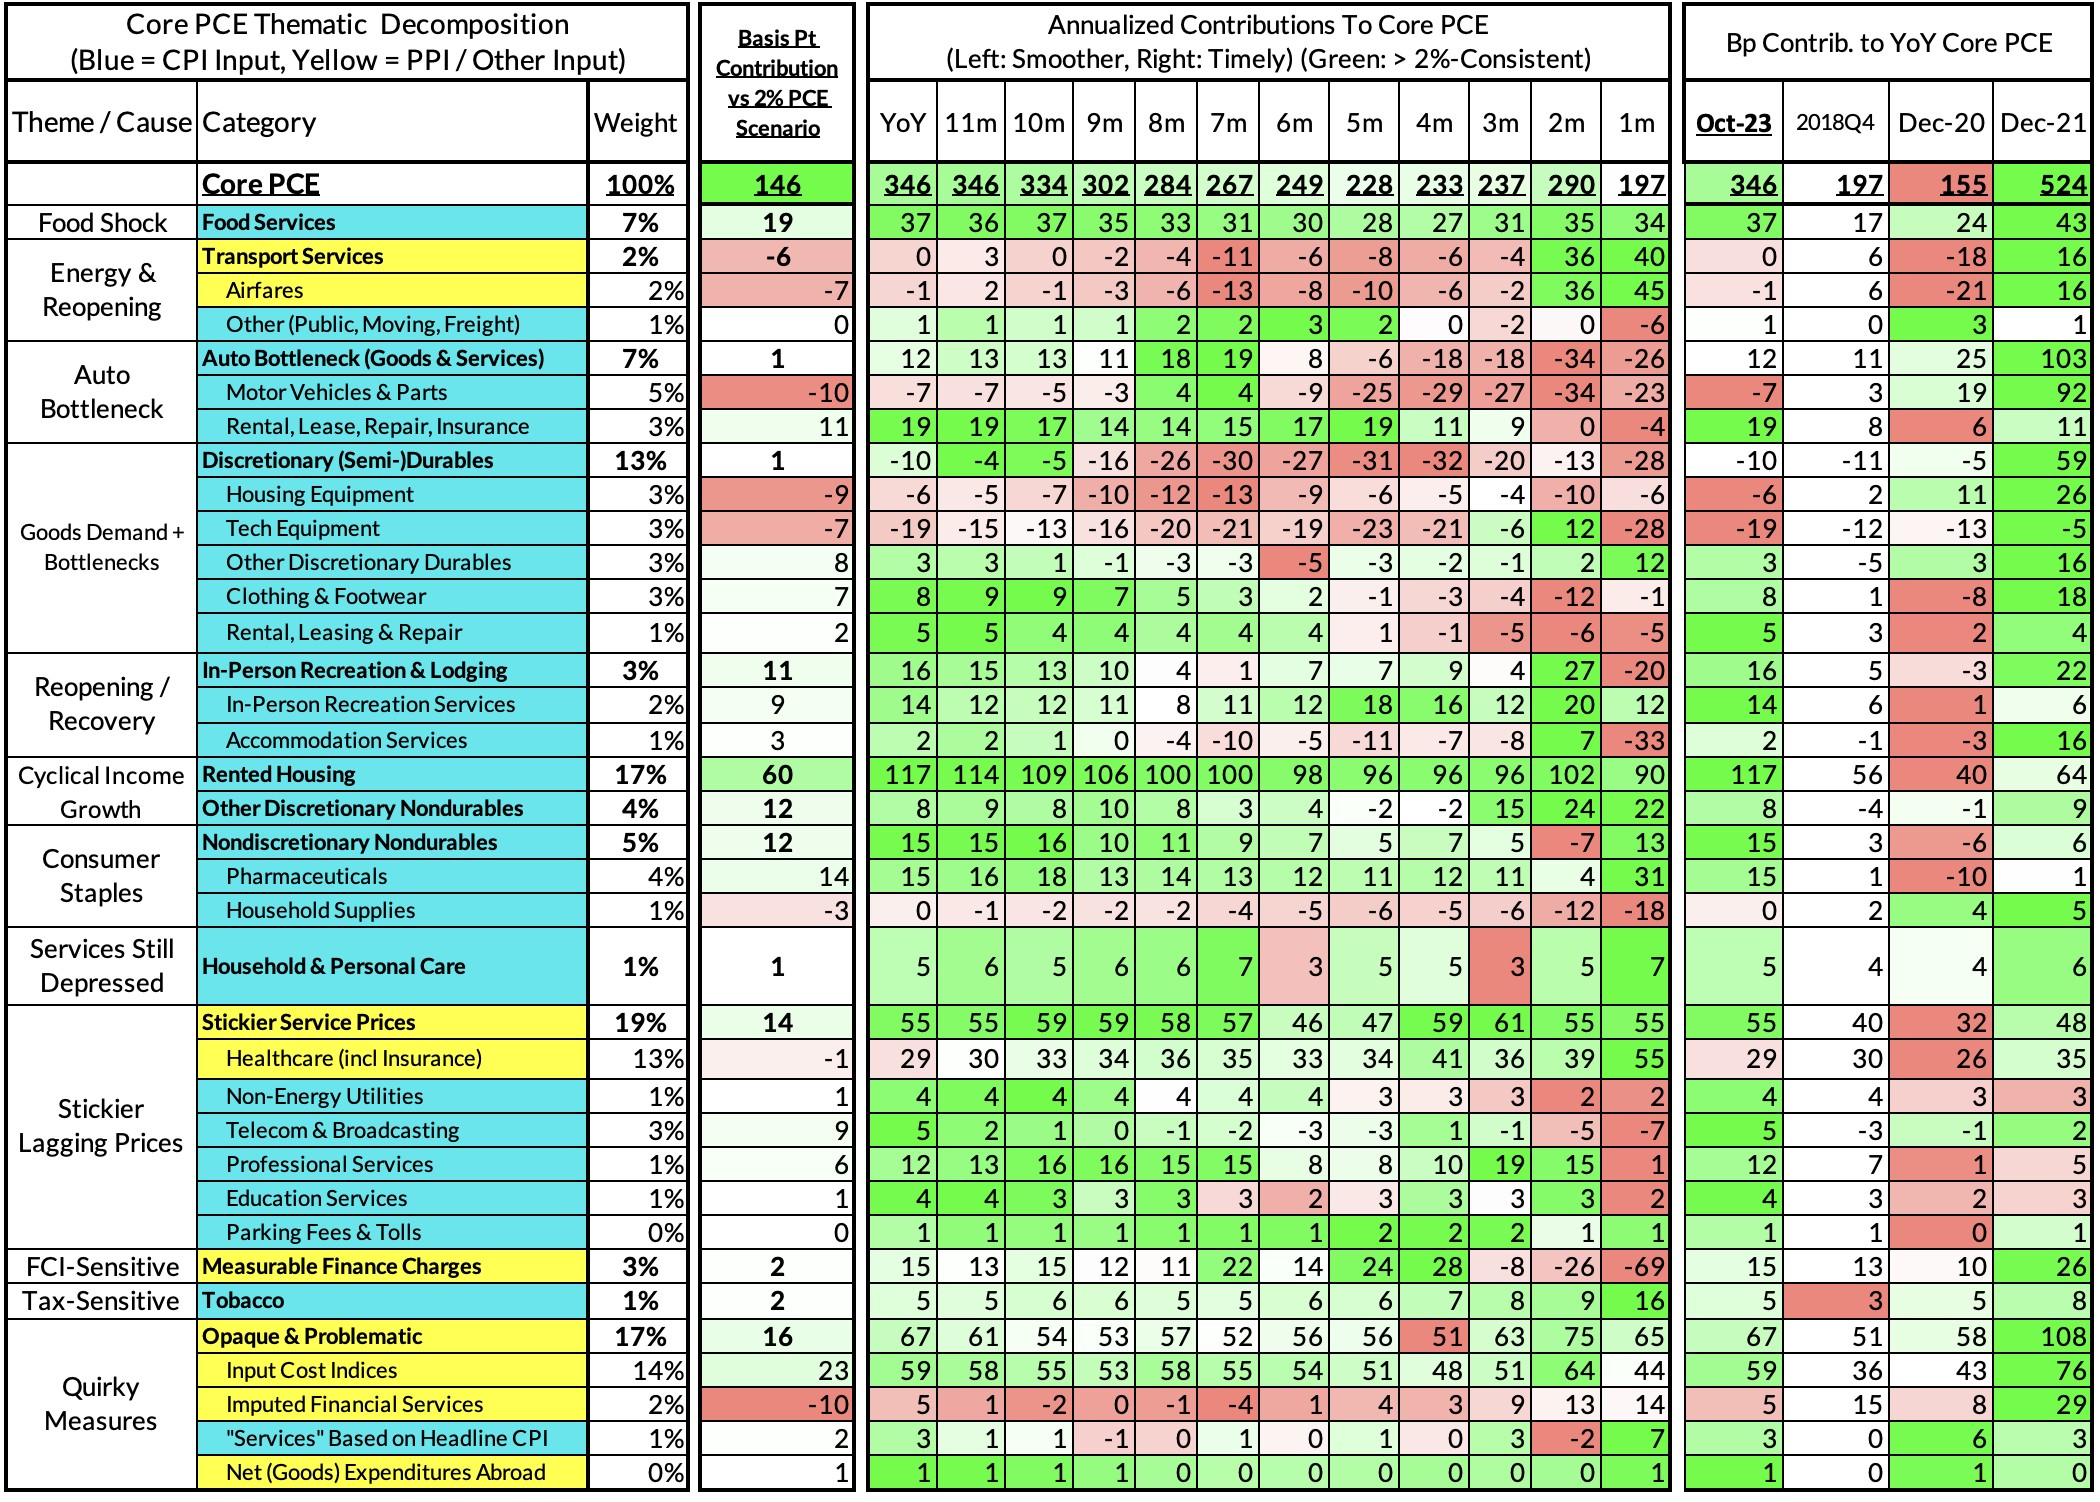
The final two heat maps below gives you a sense of the overshoot on shorter annualized run-rates. October monthly annualized core PCE yielded a 3 basis point undershoot vs 2% target inflation (1.97% annualized).
The October growth rate in "Core Services Ex Housing" ('supercore') PCE ran at 3.93% year-over-year, a 179 basis point overshoot versus the 2.56% run rate that coincided with ~2% headline and core PCE.
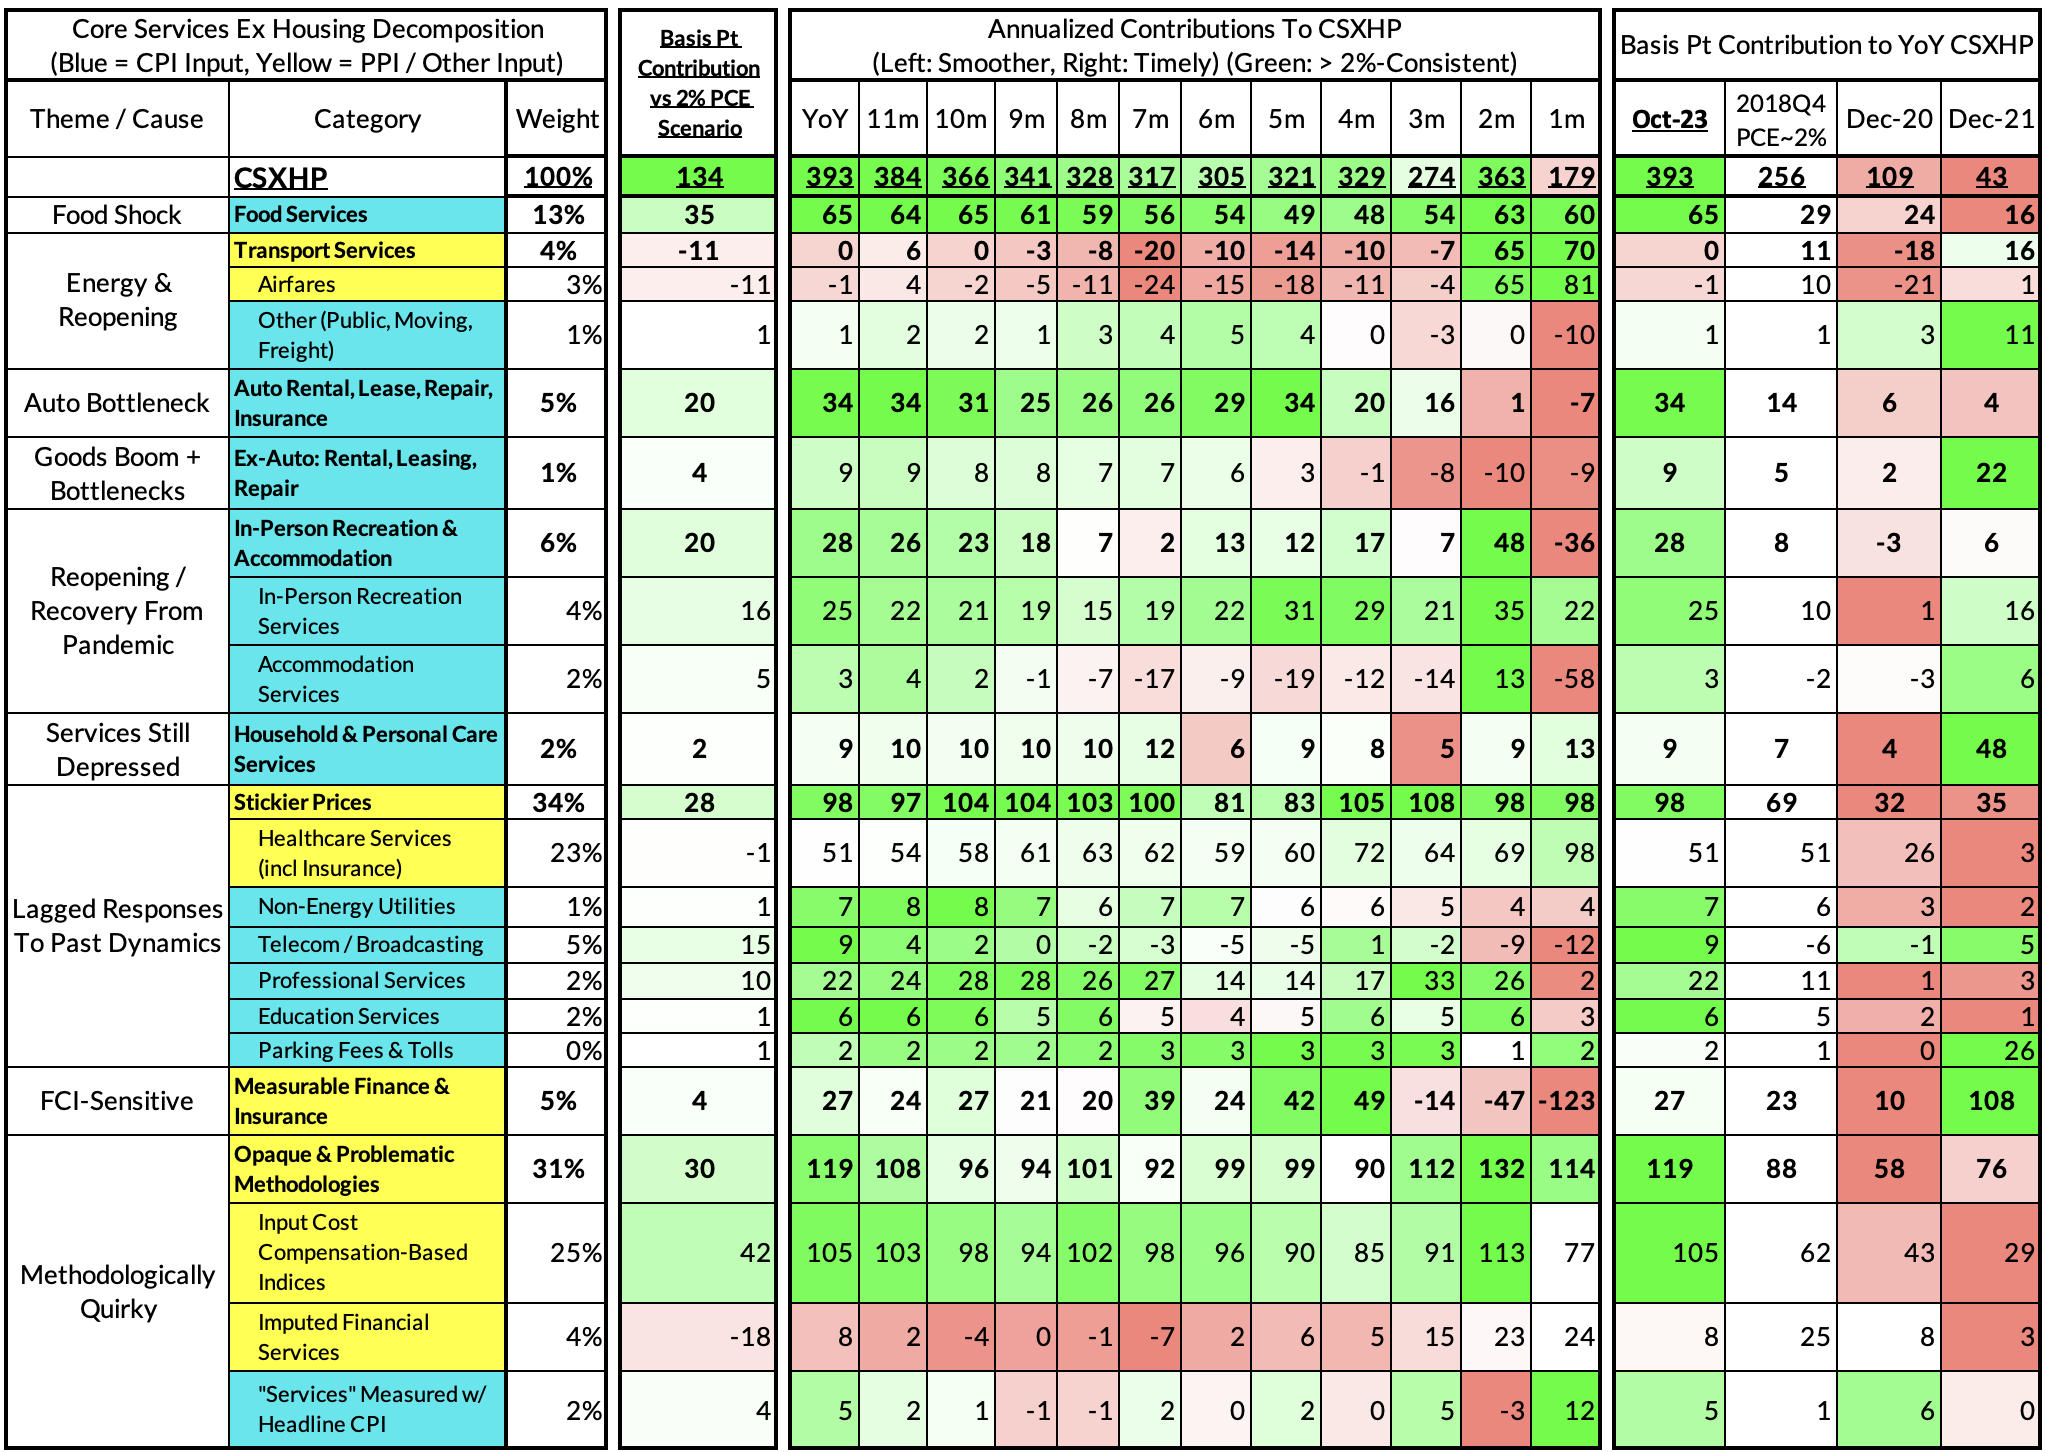
September monthly supercore ran at a 1.79% annualized rate, an 80 basis point undershoot of what would be consistent with 2% headline and core PCE.