This preview was originally released on Monday to Premium Donors. If you would like to get the first look at this kind of content, please feel free to reach out to us here or start a 30-day free trial today
Sections:
- Summary
- Key Dynamics Within Baseline View
- An Updated Roadmap To 2% Core PCE
- CPI Charts
- From Our PCE Recap (For Those Who Missed It)
- Past Inflation Previews & Commentary
Summary
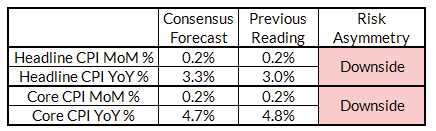
The core inflation downside risks have arrived, arguably a little ahead of what we penciled in a couple of months ago. While we saw some downside surprise last month, it was largely not from segments where we were expecting the real downside to show up in Q3. The risks for June (CPI) are now firmly tilting to the downside after a Q2 that saw another (and hopefully final) used car price spike. While upside scenarios can always be painted especially if some unexpected price declines of recent months revert, the asymmetry to the core CPI data is firmly tilted to the downside for July. From July through September, we are likely to flag downside risk to Core CPI and to a lesser extent Headline CPI. The picture should remain encouraging from a PCE perspective even after Q3 but more ambiguous for CPI (headline and core).
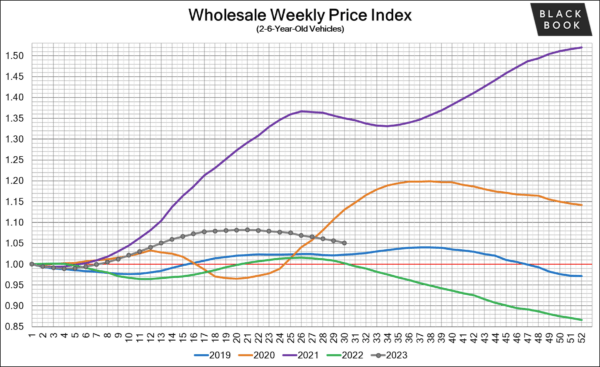
- Used cars and rent: Used cars and rent disinflation brings down our base-case for core CPI to 0.10% m/m, lower than the forecasting consensus (0.2% m/m). Even with a full reversion in the airfare CPI decline from last month, the downside drivers create more downside skew to the potential set of surprises. Such an outcome would imply two second Core PCE monthly annualized readings at or under 2%.
- Primetime For Downside: The two reasons we were not ready to flag downside risk in June CPI but are now: 1) used cars CPI is due for a substantial decline (lagging what we already know from private data), 2) rent and OER will bump month-to-month but are on a steady grind to more disnflation, 3) core goods are starting to show broader and more sustained signs of disinflation, and 4) normalizing demand and pricing power for recreation and in-person leisure services
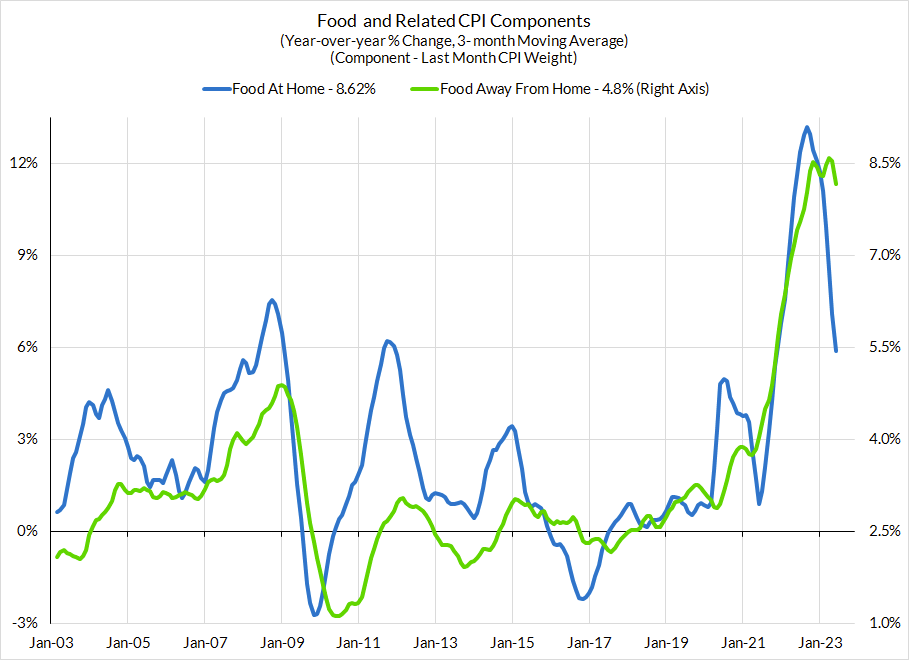
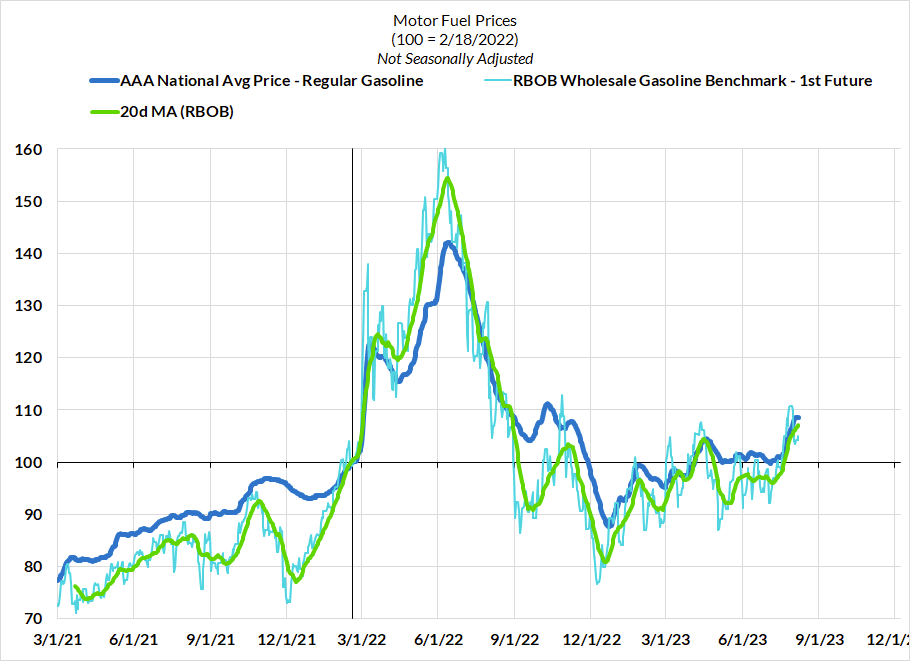
- Headline Inflation Dynamics: Disinflation in food prices and lower benchmark natural gas prices could still bring further downside risk to headline CPI than what the forecasting consensus implicitly pencils in, but that discrepancy is continuing to narrow over the course of the year. And while food services CPI doesn't count to core CPI but it does matter a lot to core and core services ex housing PCE. Ultimately though, food and food services prices are only going to show further signs of disinflation if diesel prices are able to stabilize; the recent run-up in diesel prices could quickly throw a major wrench in our basseline outlook if it continued to spike from current price levels.
- Downside Core PCE For July Would Further Blunt A September Hike: If Core CPI conforms to our base-case, or even conforms to the forecasting consensus, FOMC members' core PCE projections for 2023Q4 would have to be marked down at the September FOMC meeting. Alongside a downside set of surprises on job growth and wage growth, the basis for hiking at the September meeting would substantially weaken. If the Fed is going to hike again, it will be at the November meeting. Our baseline outlook for inflation (outsized downside in July/Aug + broader disinflation next 6-12 months) suggests that the last hike has already materialized.
Key Dynamics Within Baseline View
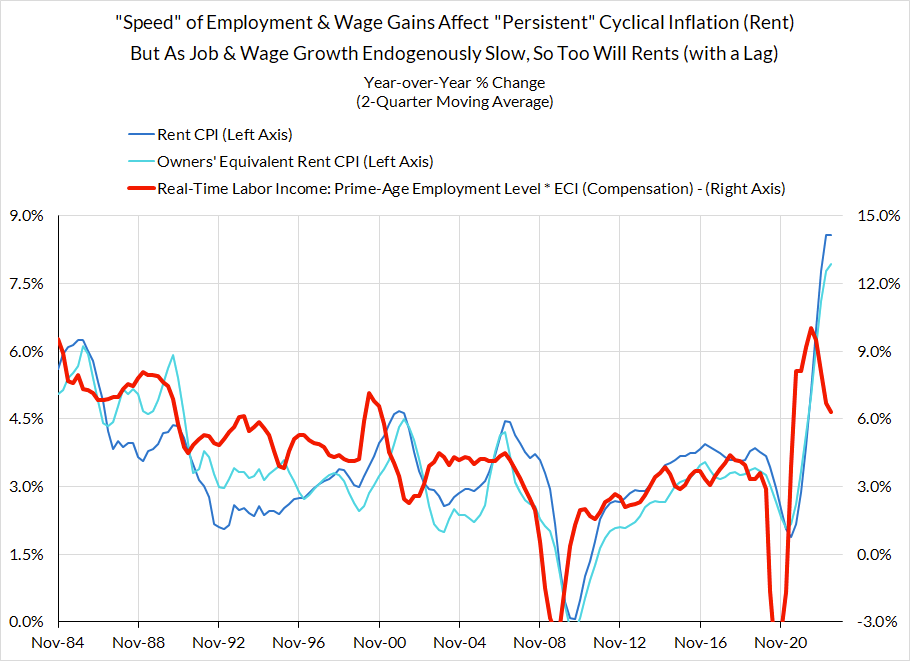
Rent inflation should take another leg down in the next three months, just as it did three months ago. Used car price deflation has continued to coil and should show outsized downside across July and August in the CPI data. And food service prices should continue to follow food prices and decelerate accordingly
An Updated Roadmap To 2% Core PCE
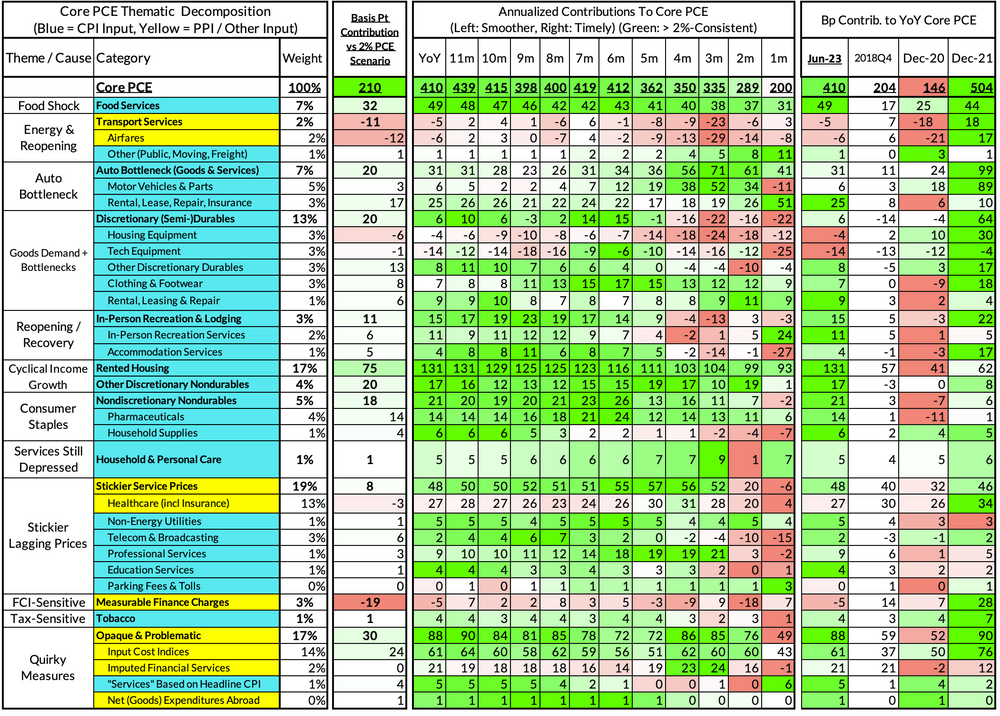
There's 210 basis points of core inflation overshoot that needs to be worked off for the Fed to hit its goals. Let's start from most important to least, with the note that a realistic 2% PCE scenario likely requires some of the categories below to not merely "stop overshooting" but to also "begin undershooting" what's consistent with 2% Core PCE.
- Rent & OER (75bps out of 210): By now everyone should know that the CPI measures lag by about 12-18 months relative to market rent measures, which had been disinflating and even deflating by some measures. Think of rent and OER as a long moving average of what the market rent data is signaling, and add on some lags to boot. The CPI housing survey likely will not show any deflation even if market rent deflation is the norm for 6-9 months. But it's currently on track to get rent & OER down to a pre-pandemic pace of inflation by June 2024, and to a lower later by 2024Q4.
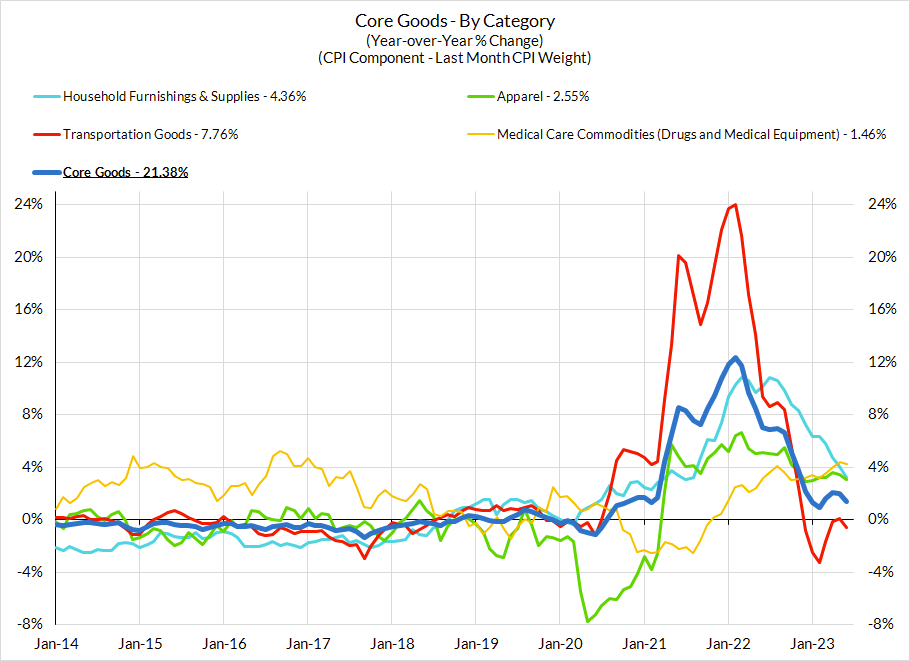
- Goods Deflation Ex Autos (58bps out of 210): Q2 saw welcome broadening of goods deflation into discretionary durables (ex autos) and consumer staples. Elevated goods demand has been substantially destroyed in the past 12 months and cost shocks through the price of transportation, diesel, and chemicals are likely only now in a position to help ease the inflation path here. And further progress will require refined products to stay in a stable range; recent developments put some of the potential progress here at risk. This process is likely to proceed slowly but last three months suggest we're on the path to 2%-consistent PCE readings here.
- Food Price Passthrough To Core Services (32bps out of 210): While most think about food service prices as a direct byproduct of wages in the sector (which have also decelerated rapidly), restaurant pricing tends to track grocery store pricing more closely, with the appropriate lag. We have seen food services prices decelerate in the past few months, with a lag to decelerating food prices. Food prices were decelerating largely as demand destruction kicked in (real food consumption flattened, same for food services) and cost structures stabilized (diesel is an important input for transporting food). The recent run-up in diesel prices could ultimately blunt the prospect for further deceleration here beyond Q3.
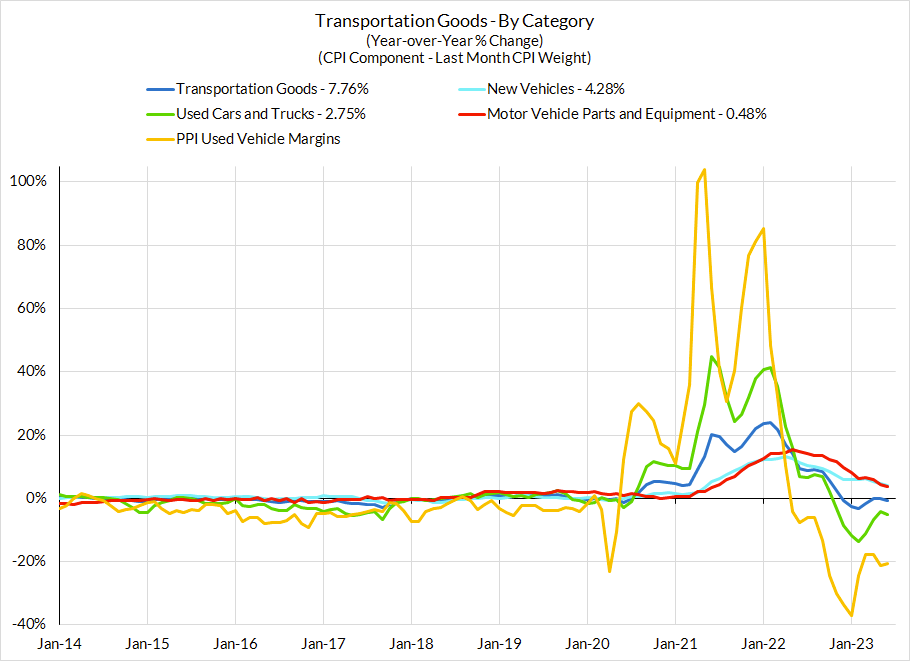
- Auto Supply Recovery (20bps out of 210): We've been dealing with depressed motor vehicle production for over 2.5 years and only in the last few months have we seen accelerated production near pre-pandemic levels. This has implications that extend beyond new and used vehicle prices, which should begin another spell of deflation in Q3. It should also cool a range of services prices that have run hot in PCE: vehicle rental, leasing, repair, and insurance. Those service prices tend to move with a lag relative to auto values but should be more of a tailwind in 2024, at least when looked at in totality. We are optimistic that the basket of prices sensitive to auto values will be a substantial driver of disinflation in the next 12-15 months.
- Stickier Service Prices (8bps out of 210): Healthcare service demand roared back in 2022 as procedures put off during the pandemic rushed back, but the latest batch of PCE data and revisions suggests more normalization in the last few months. Moreover, private payers who were willing to stomach steep price increases from providers in at the turn of the calendar year (2023Q1) appear to be less tolerant now. It remains to be seen what 2024Q1 will mean both for public and private payers of medical services but the outlook is improving. Most of the overshoot in sticky prices outside healthcare is largely a function of elevated inflation dynamics in 2022. As inflation broadly cools this year, the 2024Q1 annual-reset effect for telecom and professional services should be lower too.
- Idiosyncratic Price Effects (5bps out of 210): Input cost indices have been a substantial contributor to the inflation overshoot. These indices are basically wage data plus some PPIs, both of which are in the process of decelerating. Likewise, imputed financial services are largely supposed to lag deposit rate "catch-up" to Fed hikes; as they catch-up, imputed financial service prices fall. We received another whiff of this dynamic in June and should it kick in, it could substantially drag on core PCE. On the other hand, asset prices and rate hikes play a major role in measurable finance charges; asset price deflation lowered these measures and asset price increases now suggest a stronger outlook. Uncertainty associated with the outlook here is high
- In-Person Service Prices (11bps out of 210): Until recently, this was a major driver of the inflation overshoot but saw some chunky bits of deflation through recreation services and lodging. Revenge services demand tied to reopening appears to be cooling in nominal and real terms after a strong 2022. We expect more normalization here but with further bumps in the road given the volatility of price changes of late.
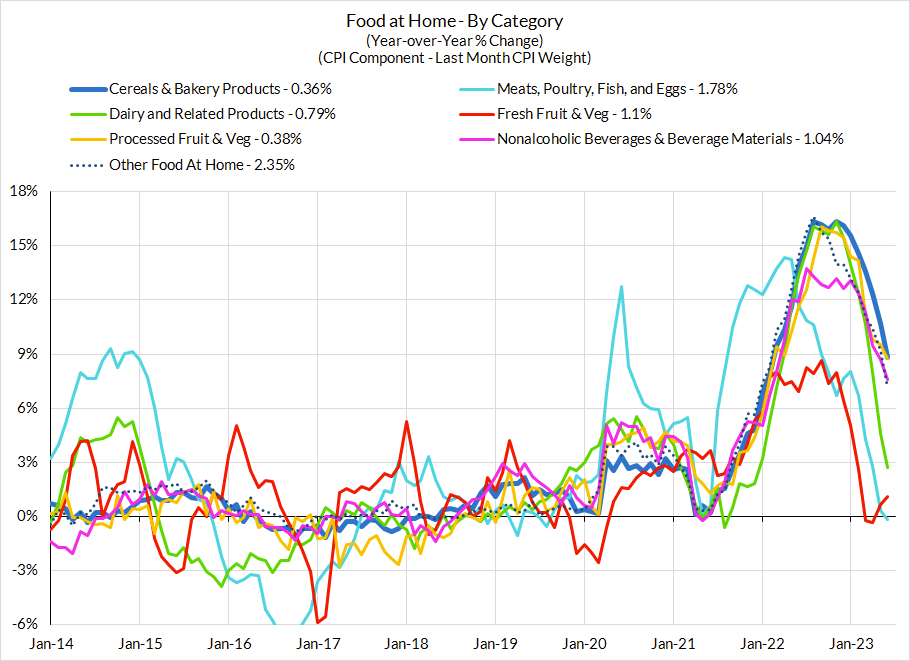
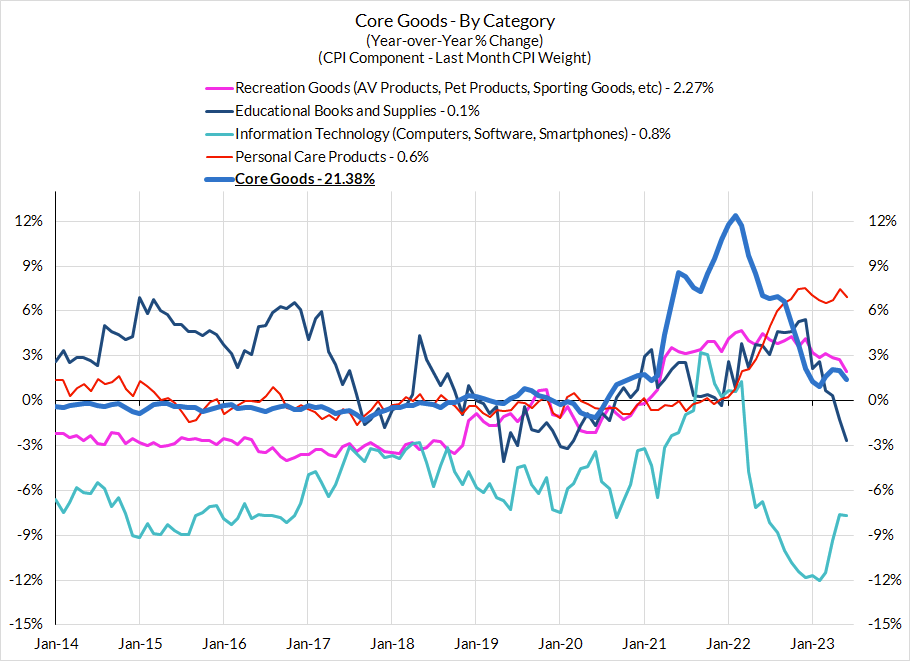
CPI Charts
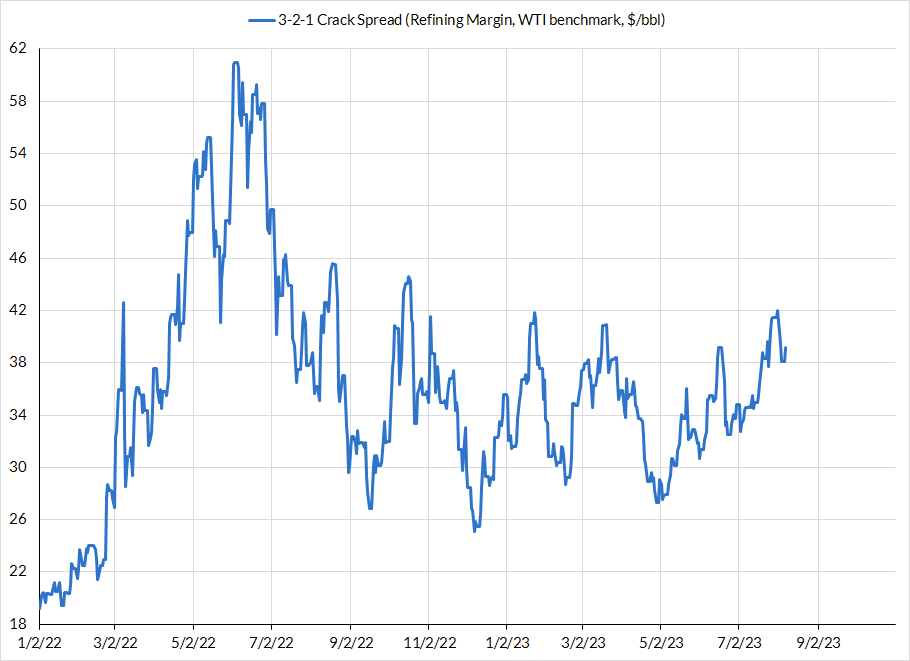
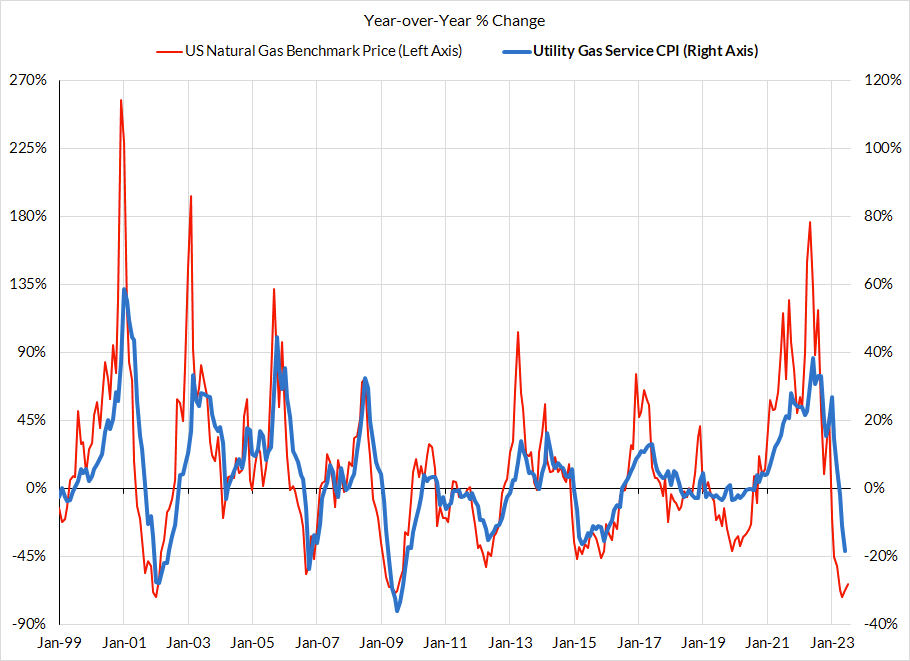
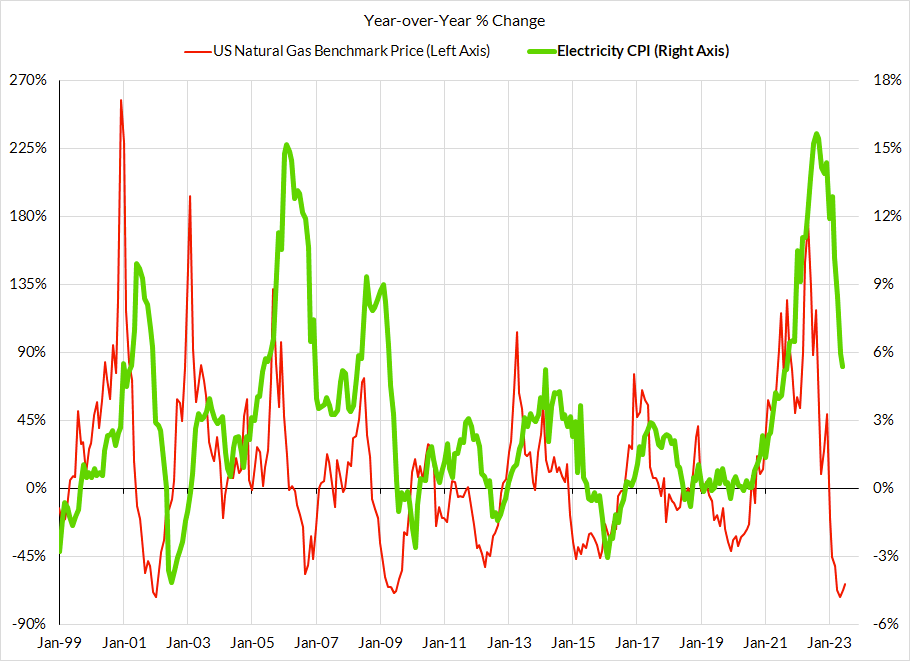
Non-Core CPI Components
Core Goods CPI Components
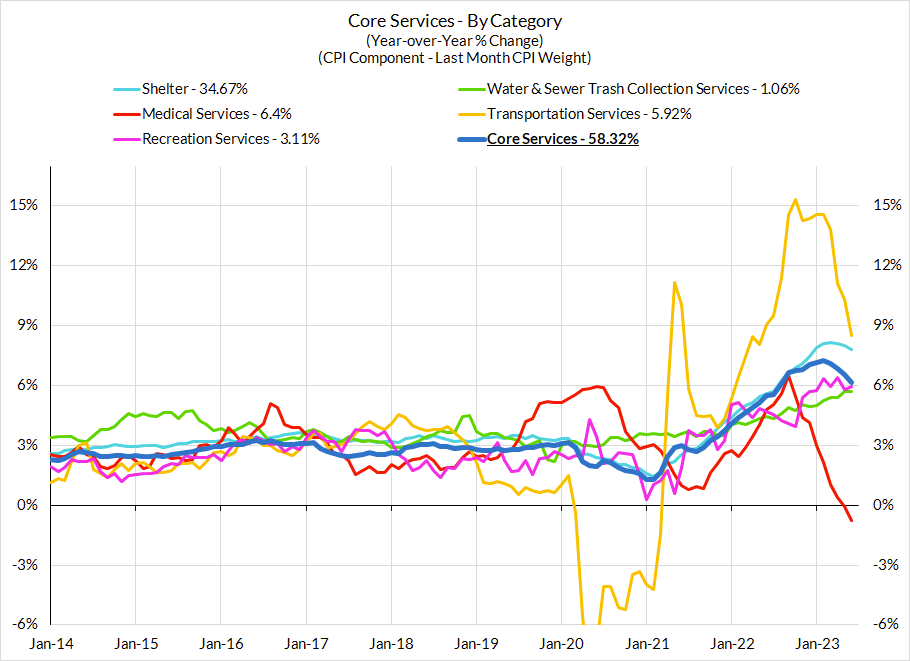
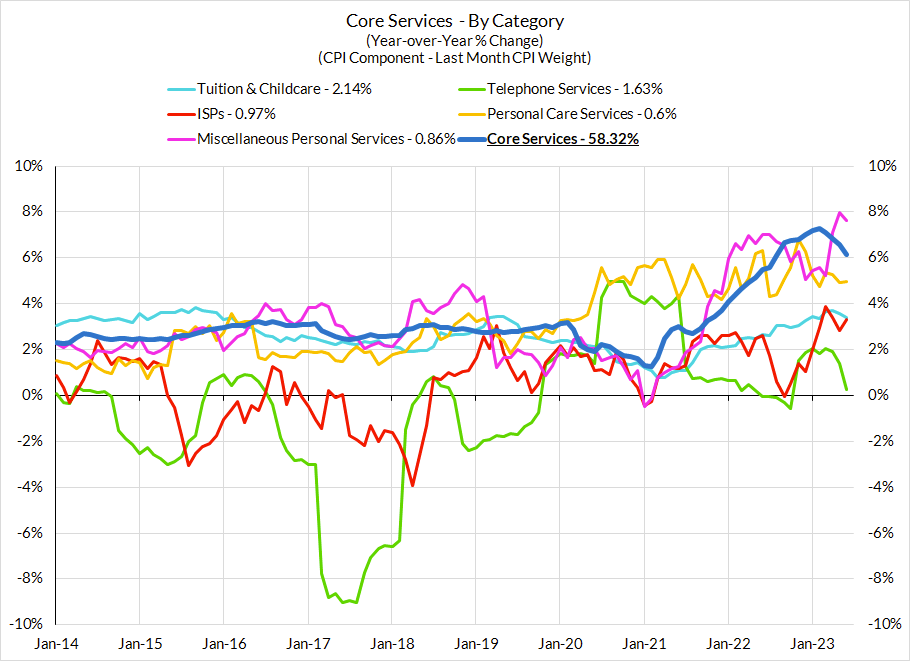
Core Services CPI Components (Not All Feed Into Core PCE)
From Our PCE Recap (For Those Who Missed It)
For the Detail-Oriented: Core PCE Heatmaps
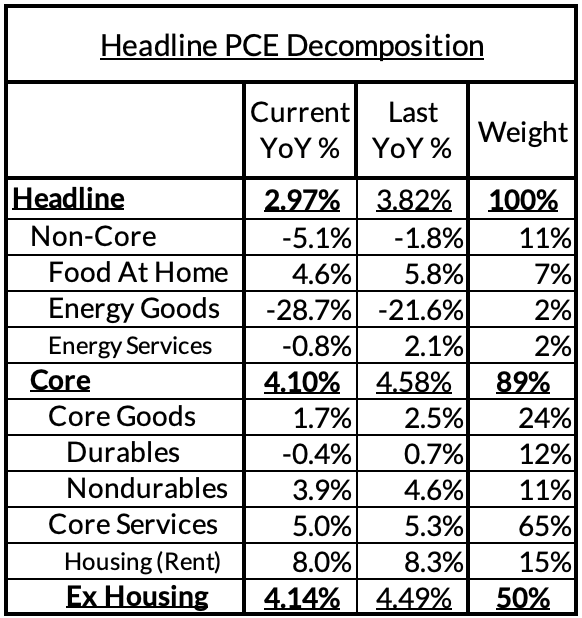
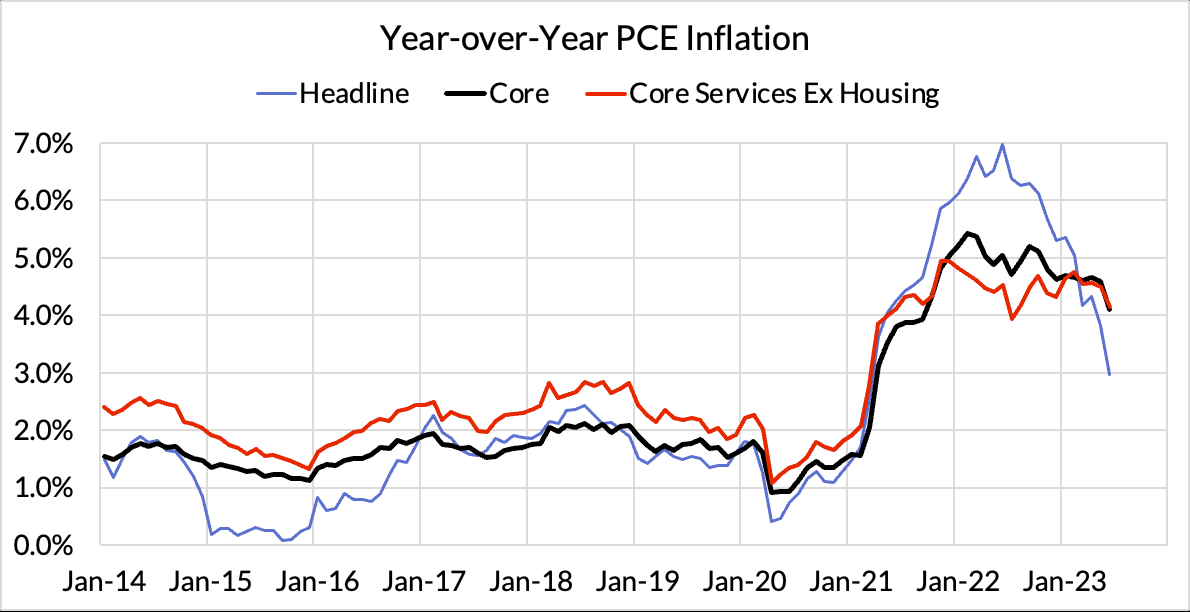
Right now Core PCE (PCE less food products and energy) running at a 4.10% as of June, 210 basis points above the Fed's 2% inflation target for PCE. That overshoot is disproportionately driven by catch-up rent CPI inflation in response to the surge in household formation (a byproduct of rapidly recovering job growth) and market rents in 2021-22. Rent is contributing 75 basis points to the 210 basis point core PCE overshoot.
There are other contributors to the overshoot:
- Some more supply-driven (automobile bottlenecks likely explain 20 basis points, while food inputs likely added 32 basis points to the overshoot)
- Some more demand-driven (in-person recreation and travel services adding 11 basis points to the overshoot)
- So with demand- and supply-side drivers (consumer staples and other discretionary goods adding 58 basis points).
- Some oddball segments have offsetting effects (measured financial service charges are dragging 19 basis points, while contributions from input cost indices and imputed financial services add 30 basis points to Core PCE vs 2%-consistent outcomes).
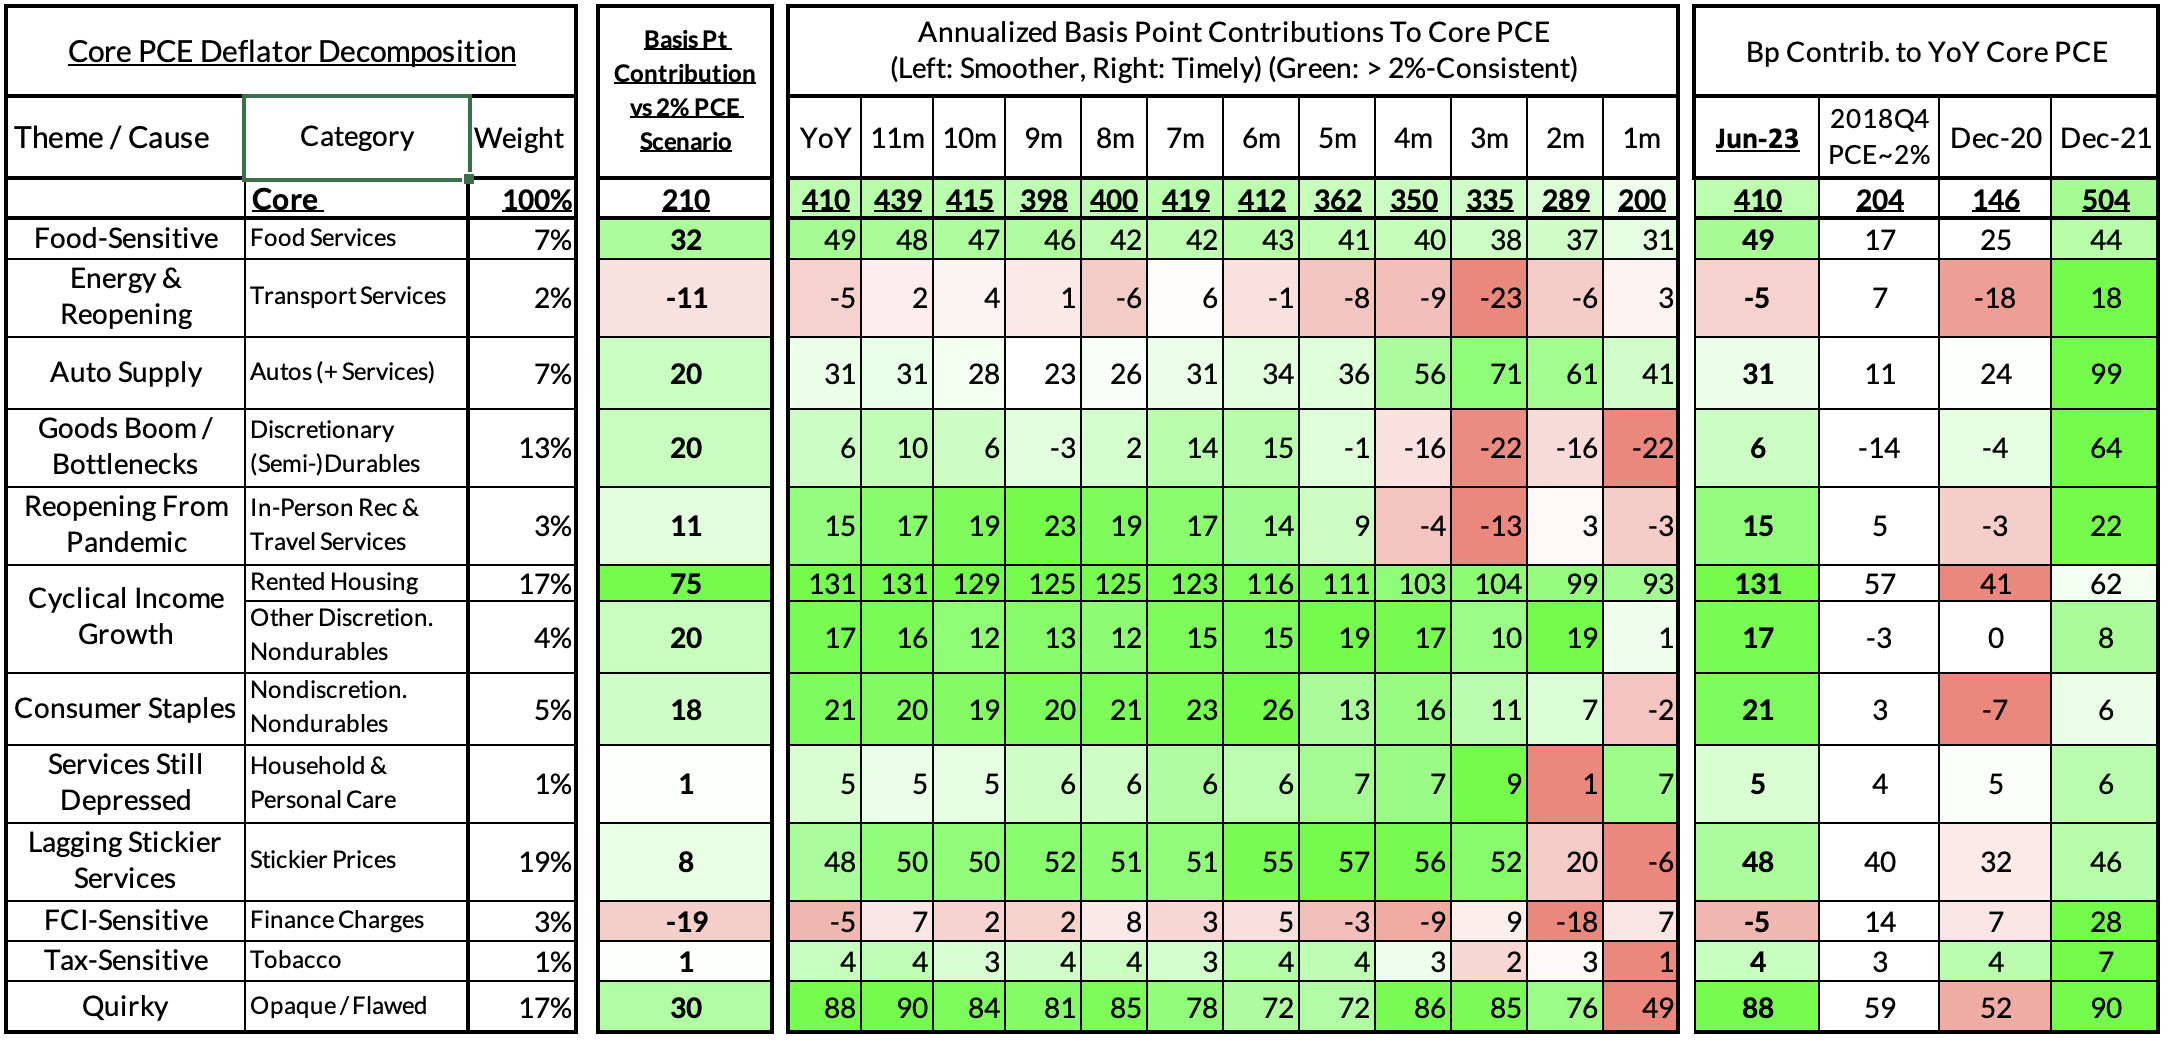
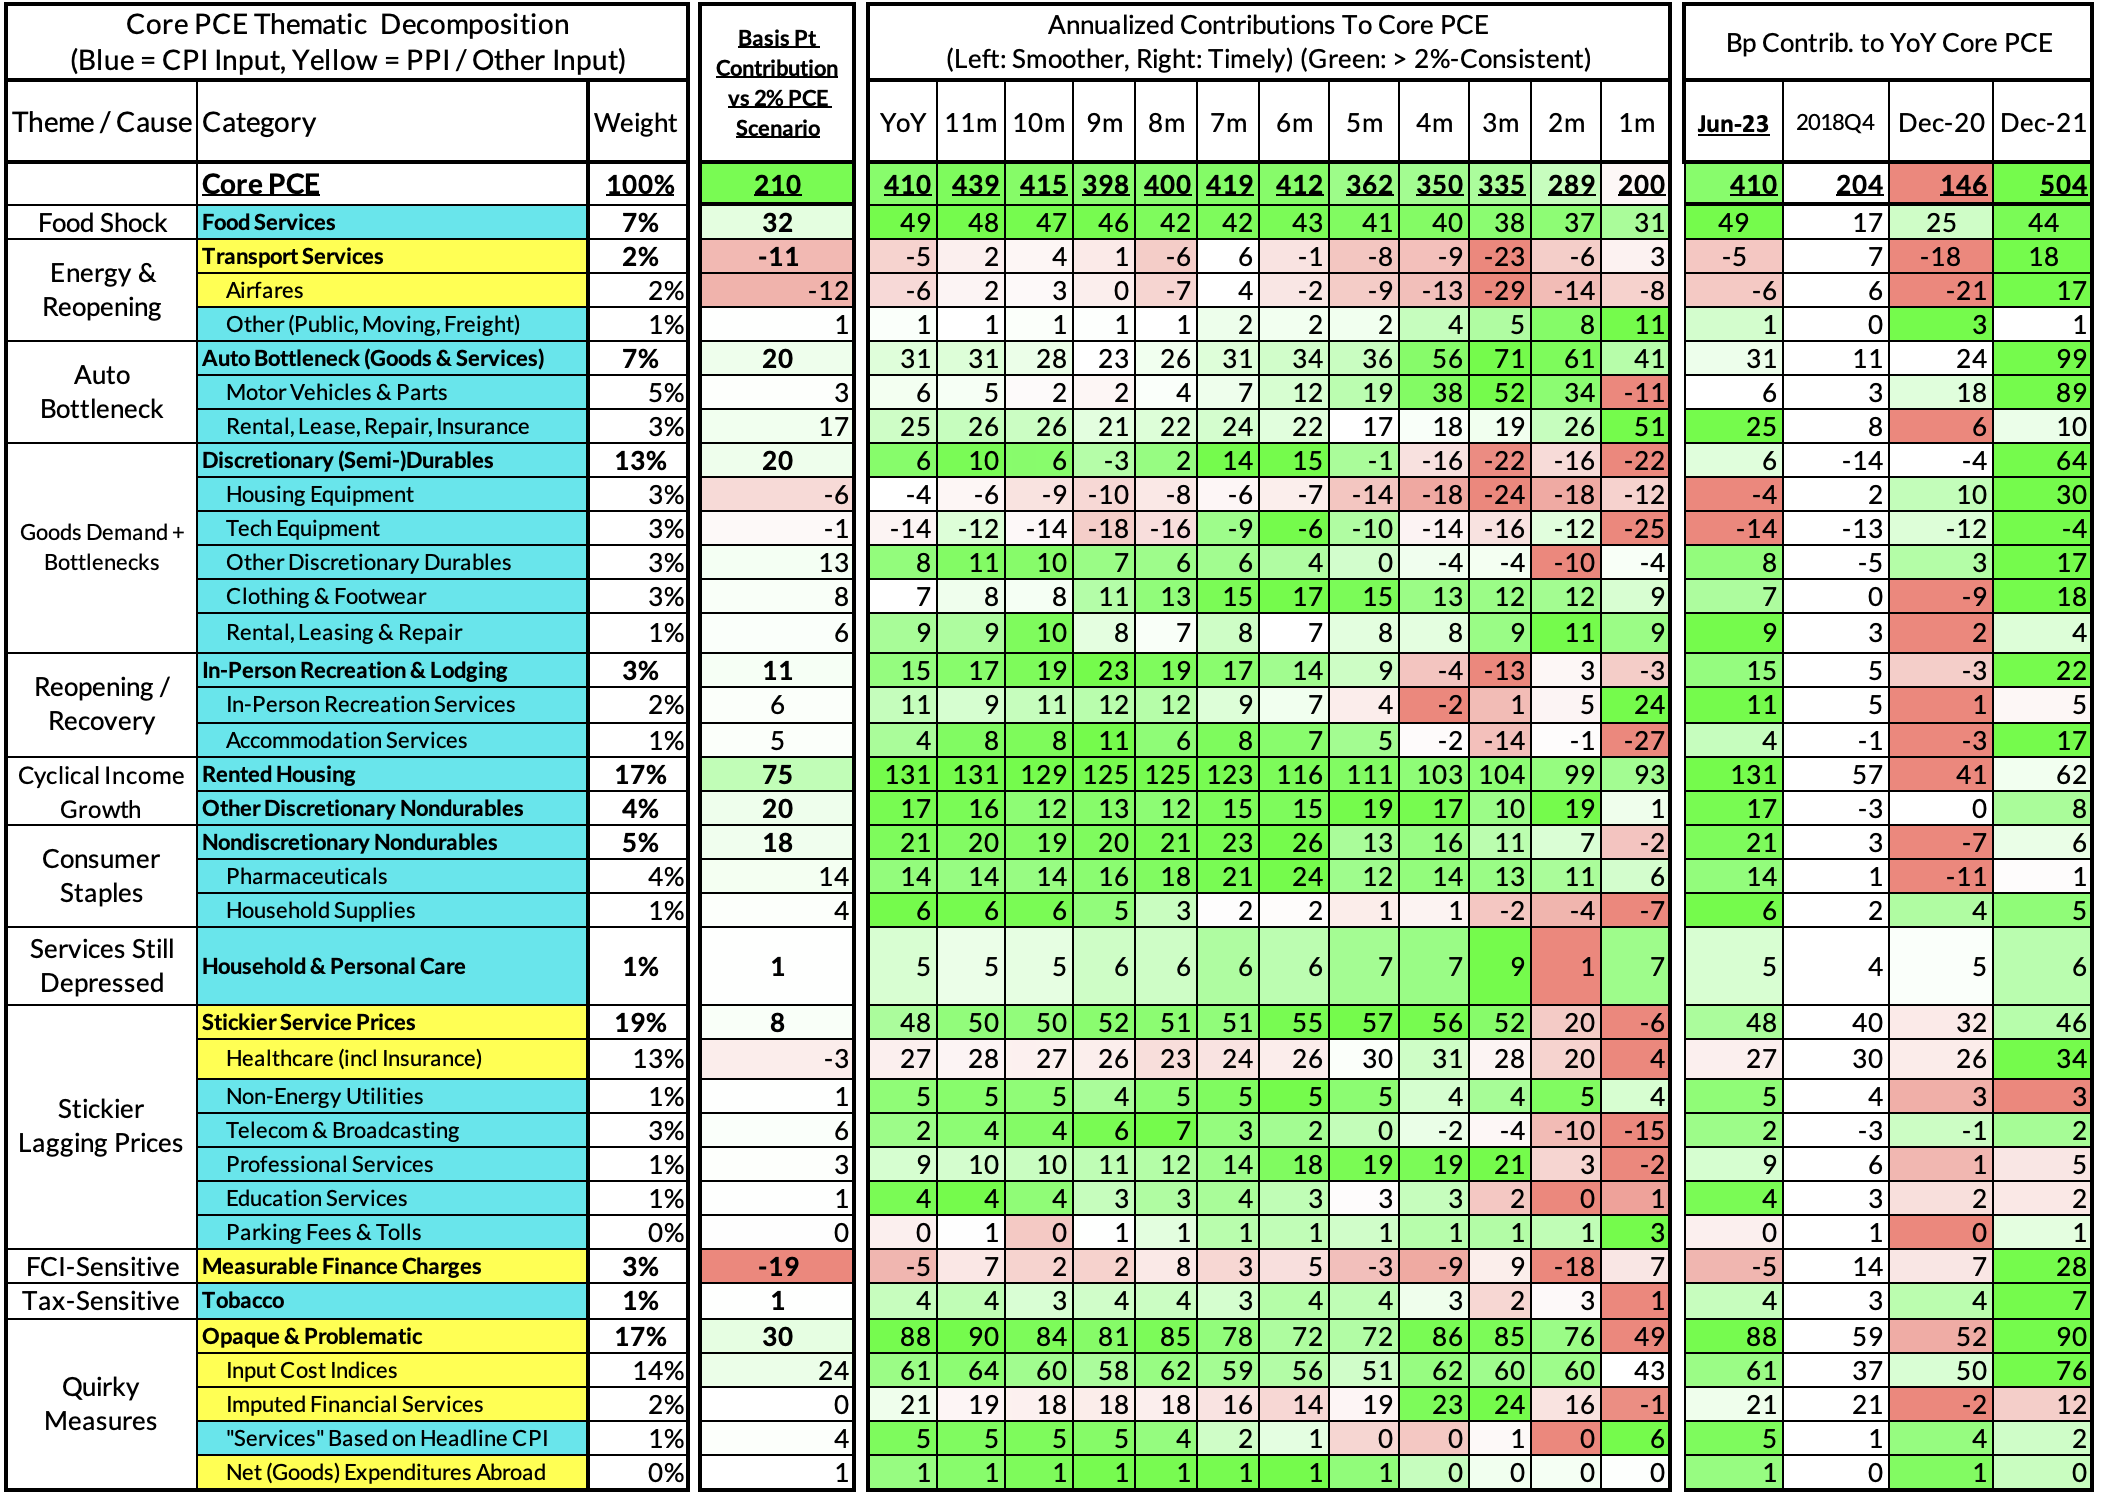
The final heatmap gives you a sense of the overshoot on shorter annualized run-rates. Monthly annualized June core PCE likely was right on the screws with the 2% inflation target.
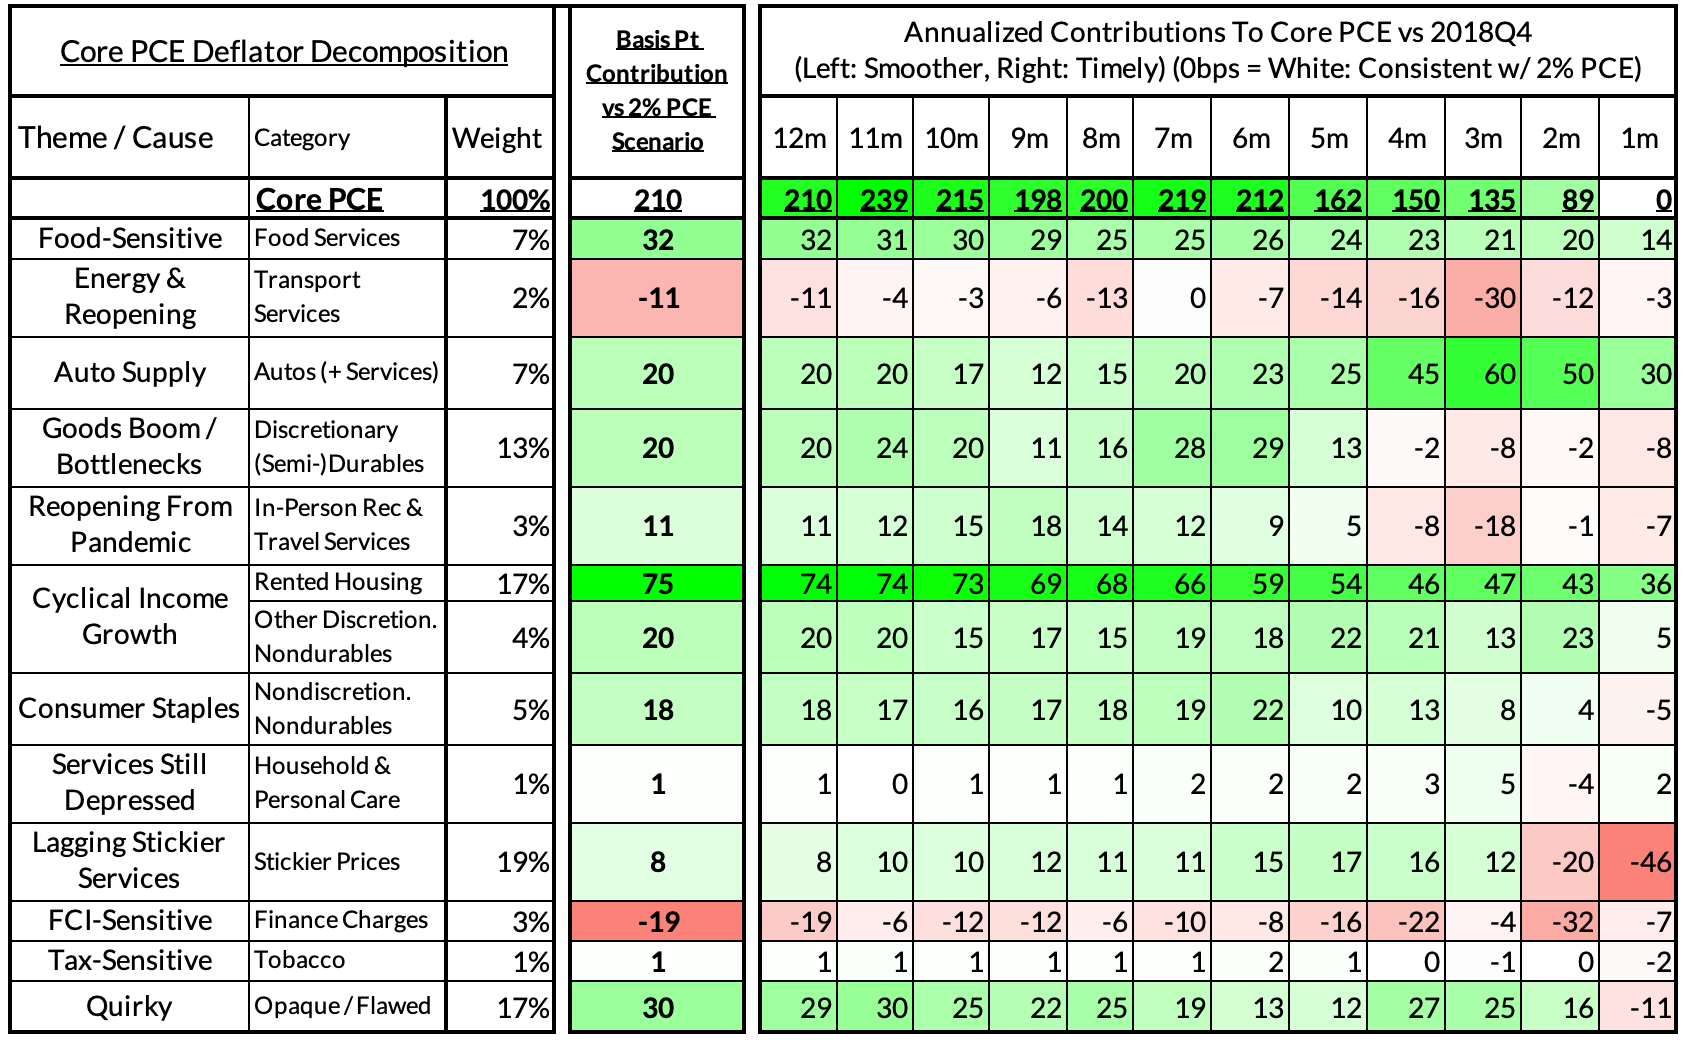
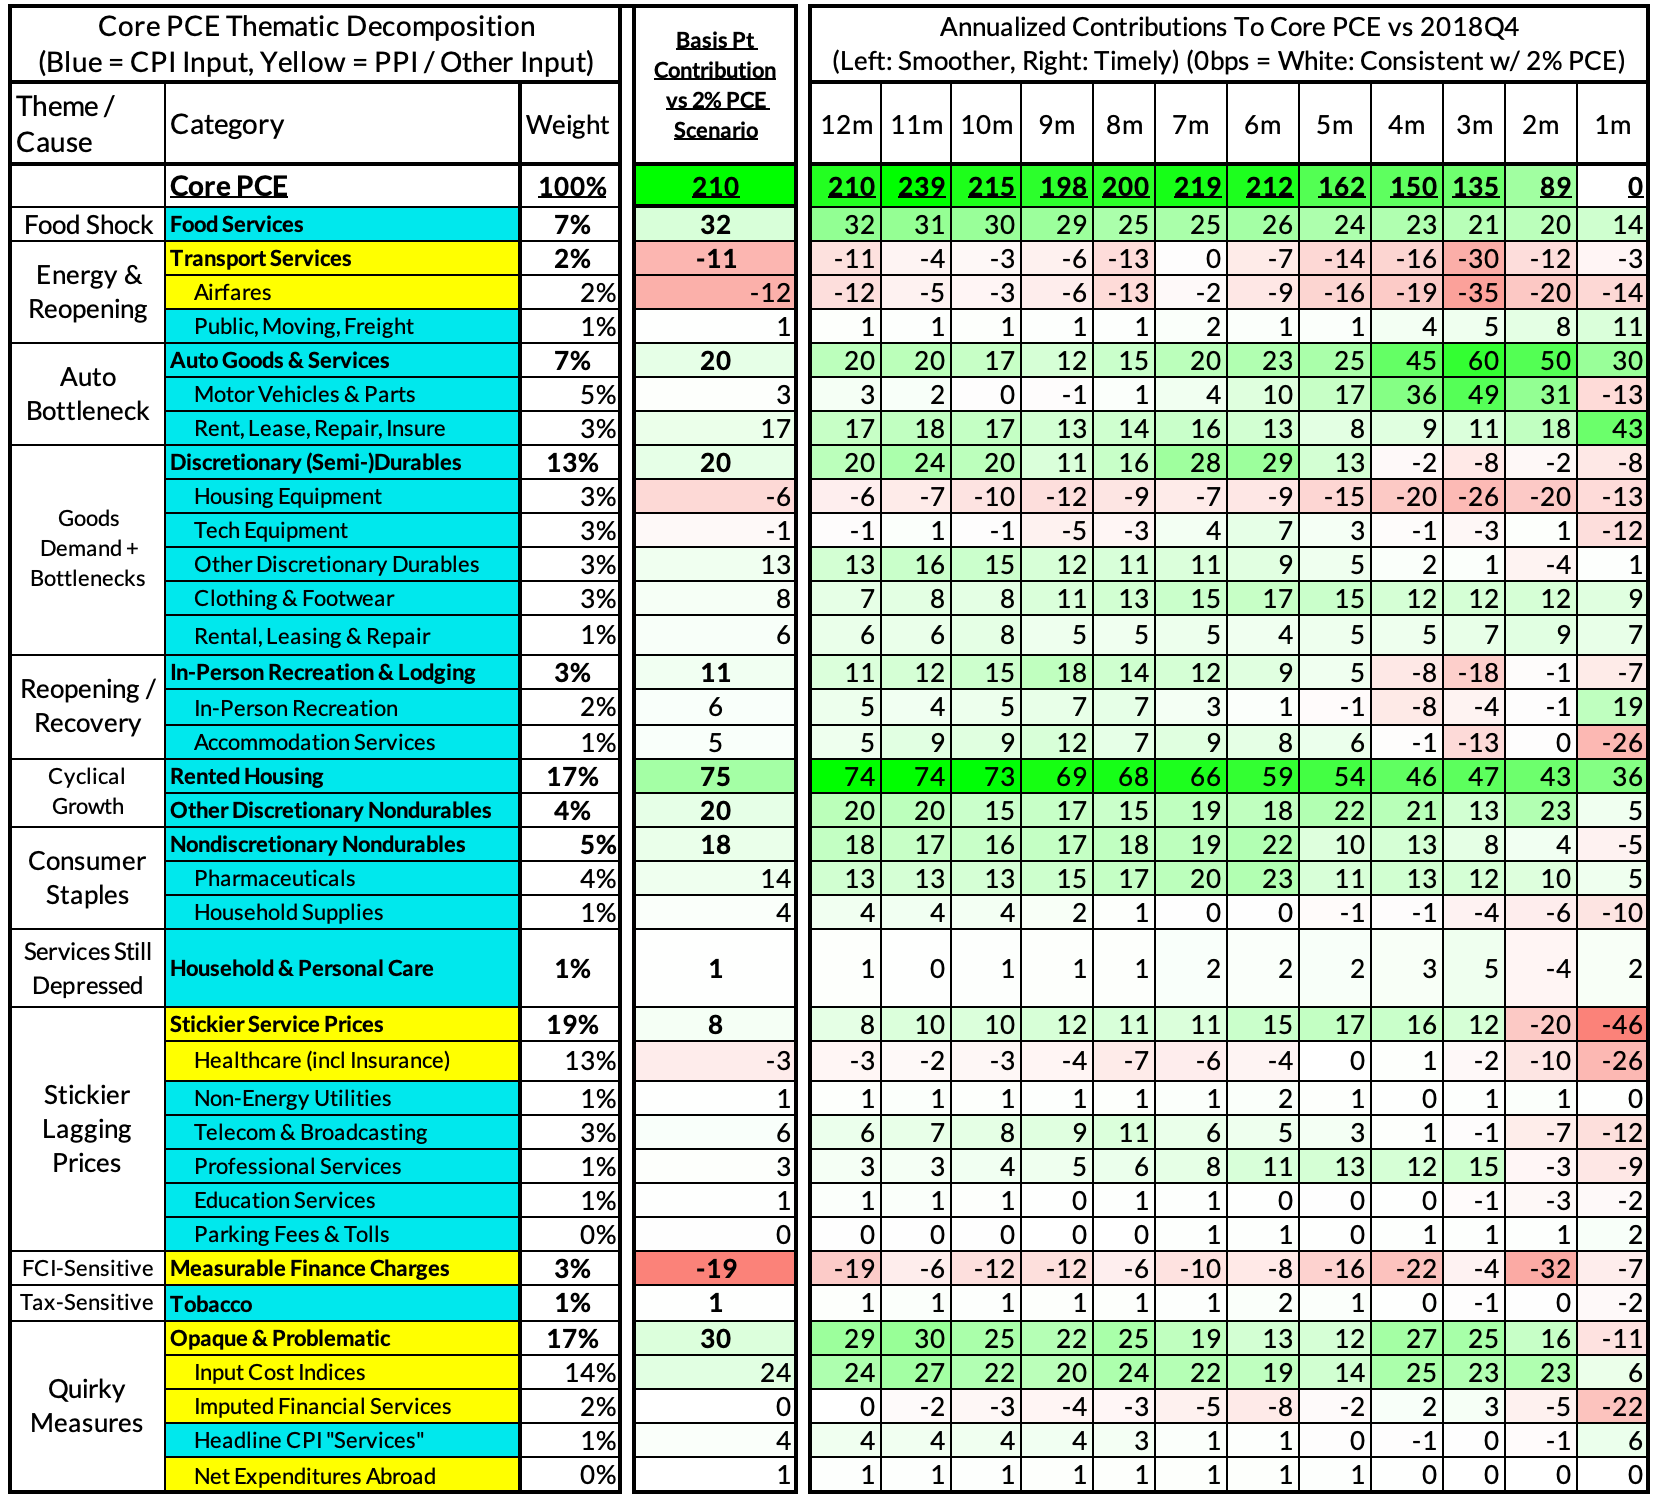
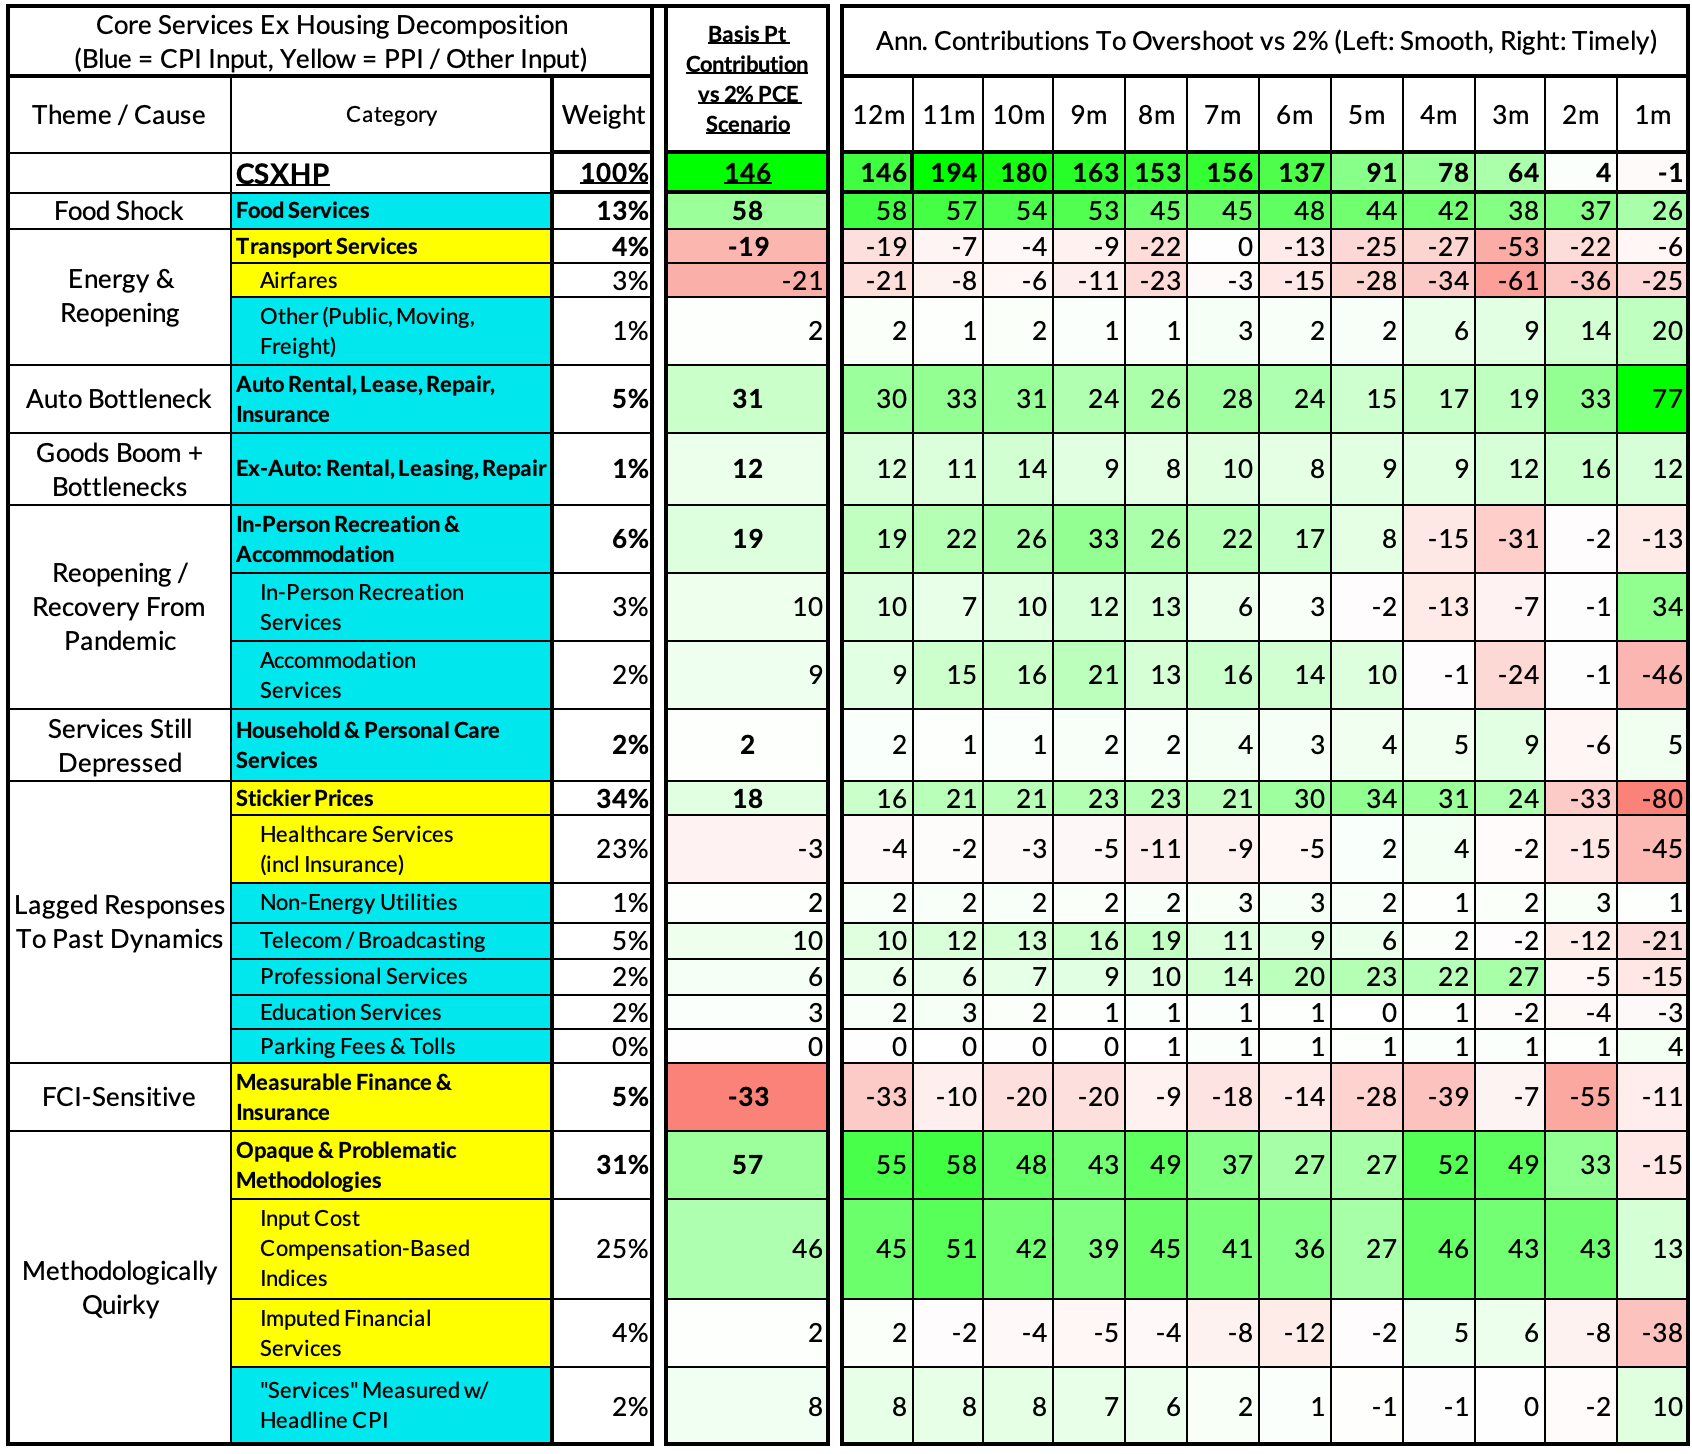
For the Detail-Oriented: Core Services Ex Housing PCE Heatmaps
The June growth rate in "Core Services Ex Housing PCE" was 4.14% year-over-year, a 146 basis point overshoot versus the 2.68% run rate that coincided with ~2% headline and core PCE.
- Supply: Food and auto goods supply challenges have driven an overshoot in their services counterparts, 58 and 31 basis points contribution to CSXHP respectively.
- Demand: "Revenge demand" for in-person leisure and hospitality services adds another 19 basis points to the CSXHP overshoot.
- Sticky: Stickier prices are starting to show signs of decelerating locally but still add 18 basis points to the year-over-year overshoot. These include healthcare, telecommunication, and professional services.
- Wage-Input: Input cost indices are adding 46 basis points to the CSXHP overshoot due to elevated nominal wage growth and PPI-specific inflation.
- Deposit rates: Imputed financial services only add 2bps to the CSXHP overshoot but have potential scope to substantially undershoot in the next 4-6 quarters
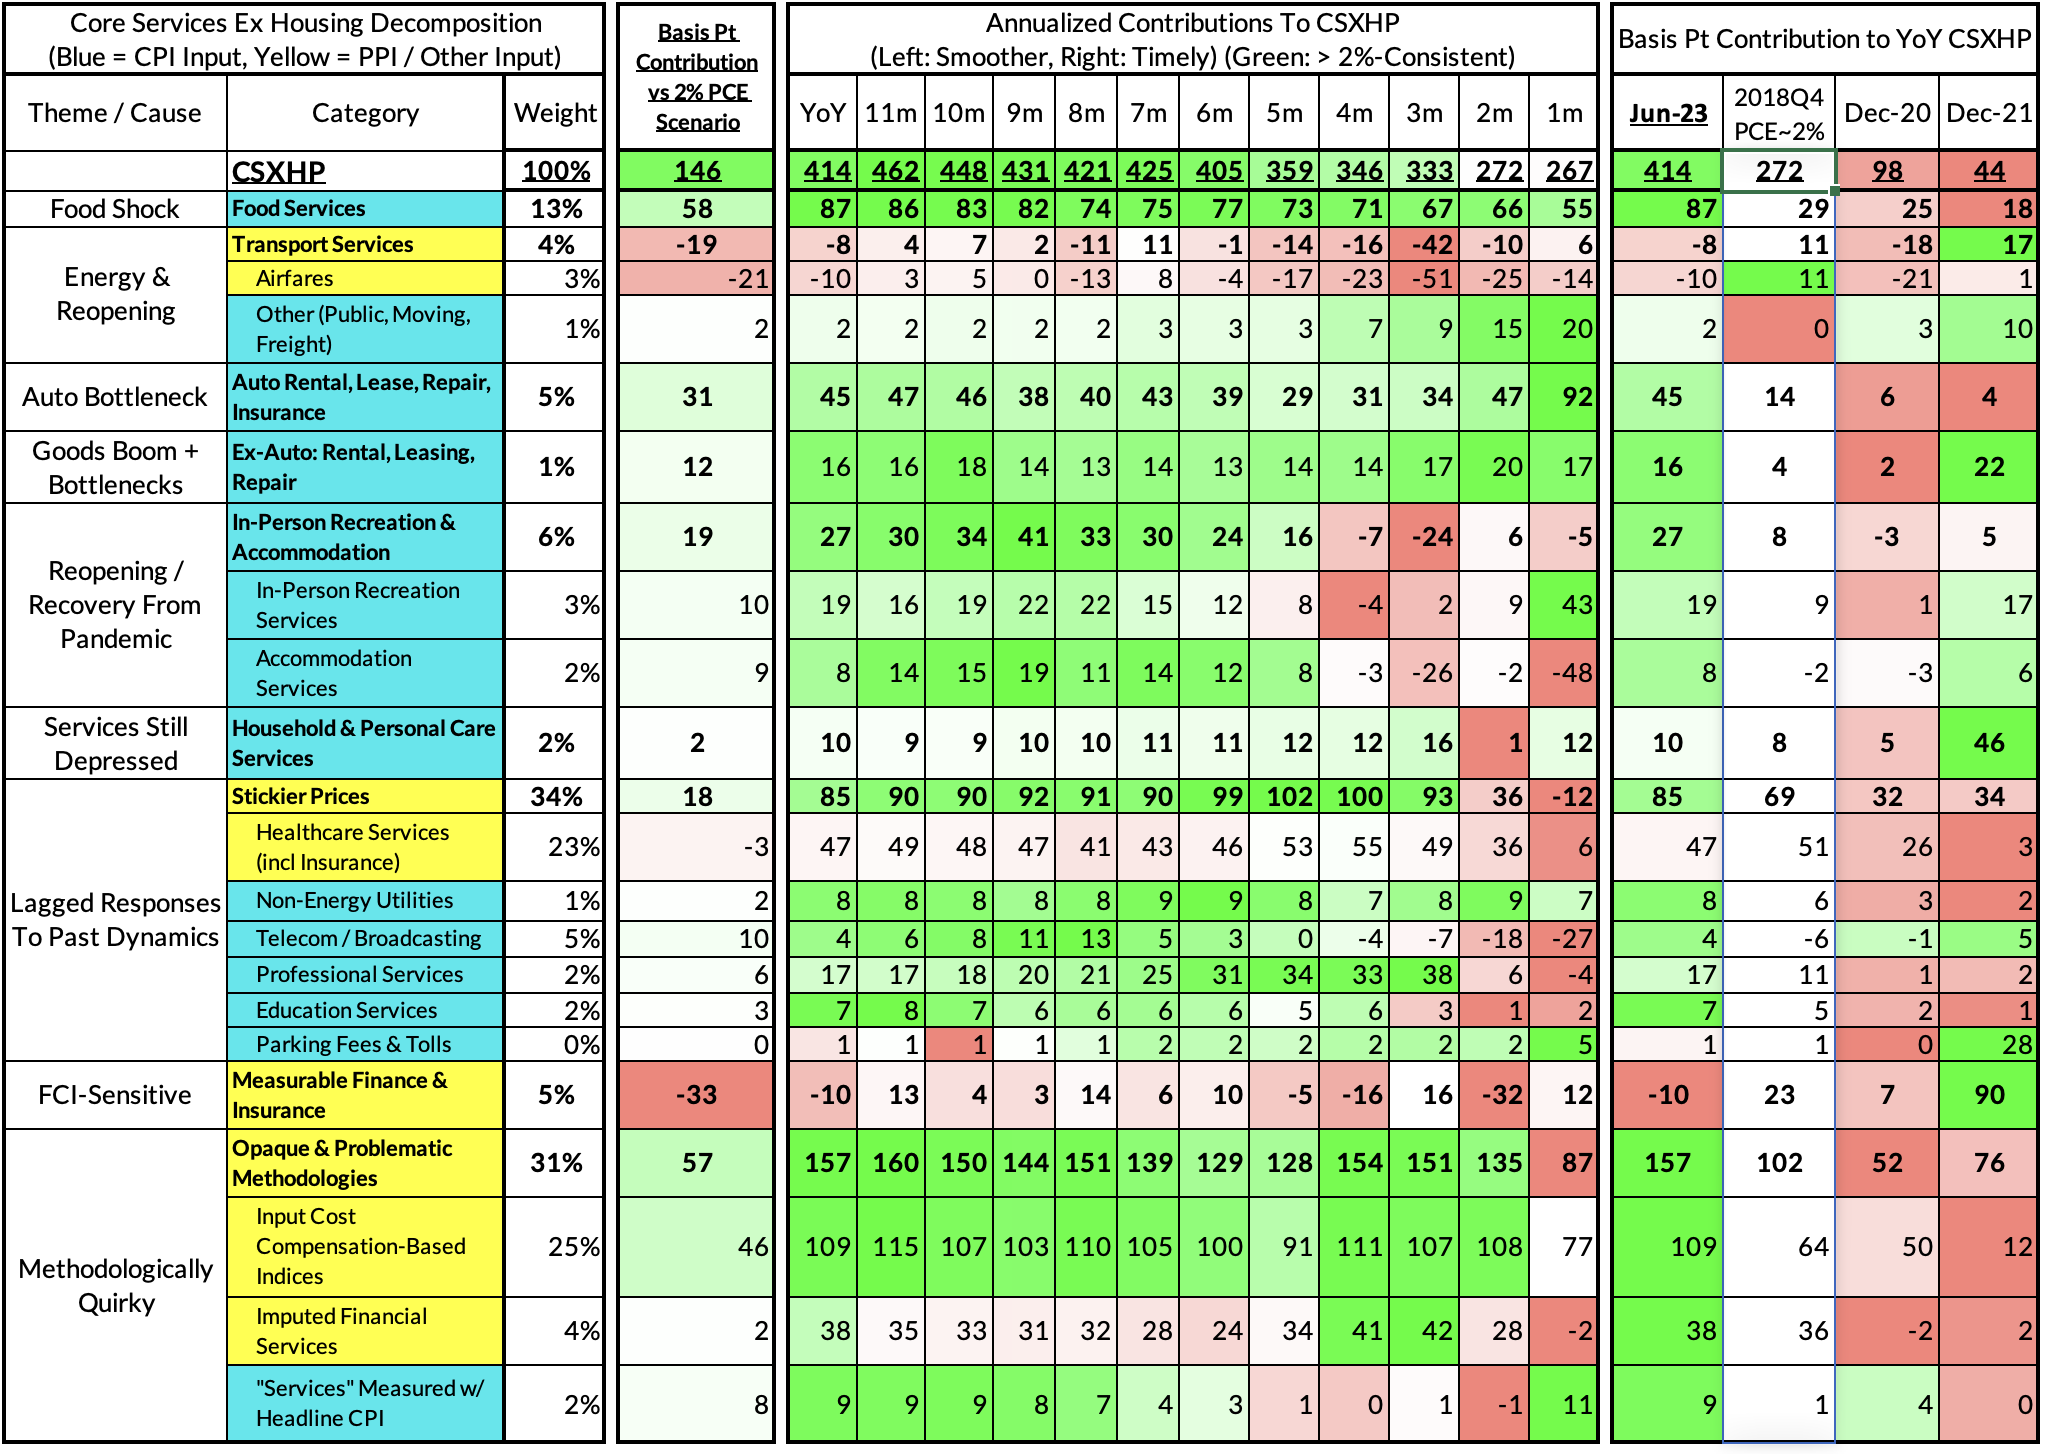
We are seeing increasing evidence of a potentially serious deceleration in the services ex housing PCE components of CPI. June monthly CSXHP ran at a 2.67% annualized rate, a basis point below what would be consistent with 2% headline and core PCE.
Past Inflation Previews & Commentary
- 2/12/21: The Good, The Bad, and The Transitory
- 10/27/21: Offsetting Persistent Inflationary Pressures With Disinflationary Healthcare Policy
- 11/8/21: Q4 CPI Preview: What Will Hot Q4 Inflation Tell Us About 2022 Dynamics?
- 12/9/21: November CPI Preview: Planes, Constraints, and Automobiles: What to Look For in a Hot November CPI Print
- 2/9/22: January CPI Preview: Calendar Year Price Revisions Skew Risks To The Upside in January, But The Balance of Risks May Shift Soon After
- 3/9/22: Feb CPI - Short Preview: Inflection Points - Headline Upside (Putin), Core Downside (Used Cars)
- 4/11/22: March CPI Preview: Managing The Endogenous Slowdown: Transitioning From A Rapid Recovery To Non-Inflationary Growth
- 5/10/22: April CPI Preview: Subtle Headline CPI Upside, But Core PCE Should Reveal More Disinflation
- 6/9/22: May Inflation Preview: Peak Inflation? Not So Fast, My Friend. Upside Surprises Loom Large
- 7/12/22: June Inflation Preview: Lagging Consensus Catches Up To Hot Headline, But Relief Nearing…
- 8/8/22: July Inflation Preview: Finally, Fewer Fireworks
- 9/9/22: August Inflation Preview: Can Used Cars & Gasoline Overcome The Rest of The Russia Shock?
- 10/12/22: September Inflation Preview: Timing The Goods Deflation Lag Amidst Hot Inflation Prints
- 11/12/22: October Inflation Preview: When Will We See The 'Real' Goods Deflation Materialize? Until Then, Rent Rules Everything Around Me
- 12/12/22: November Inflation Preview: The Goods Deflation Cavalry Is Coming, But OER Can Upset An Optimistic Consensus Tomorrow
- 1/11/23: December Inflation Preview: Risks Skew To The Downside, But Upside Scenarios Remain Plausible
- 2/12/23: January Inflation Preview: Residual Seasonality & Stickier Services Pose Upside Risks
- 3/9/23: February Inflation Preview: Q1 Upside Risks Remain. Goods and Reopening-Sensitive Sectors Matter More Than Wages
- 4/8/23: March Inflation Preview: The Fed Seems Unaware We're Entering Another Automobile Inflation Storm
- 5/7/23: April Inflation Preview: Can PCE Silver Linings Overcome CPI Bite from the Used Cars Wolf and a "Slow Slowdown" in Rent CPI?
- 6/9/23: May Inflation Preview: Last Month of Used Cars Driving Upside Risk?
- 7/9/23: June Inflation Preview: The Path To The Fed's 2% PCE Goals Is Getting Clearer But Not Soon Enough To Forestall a July Hike