August Inflation Preview: CPI Risks Growing More Balanced Even As PCE Risks Tilt More To The Downside

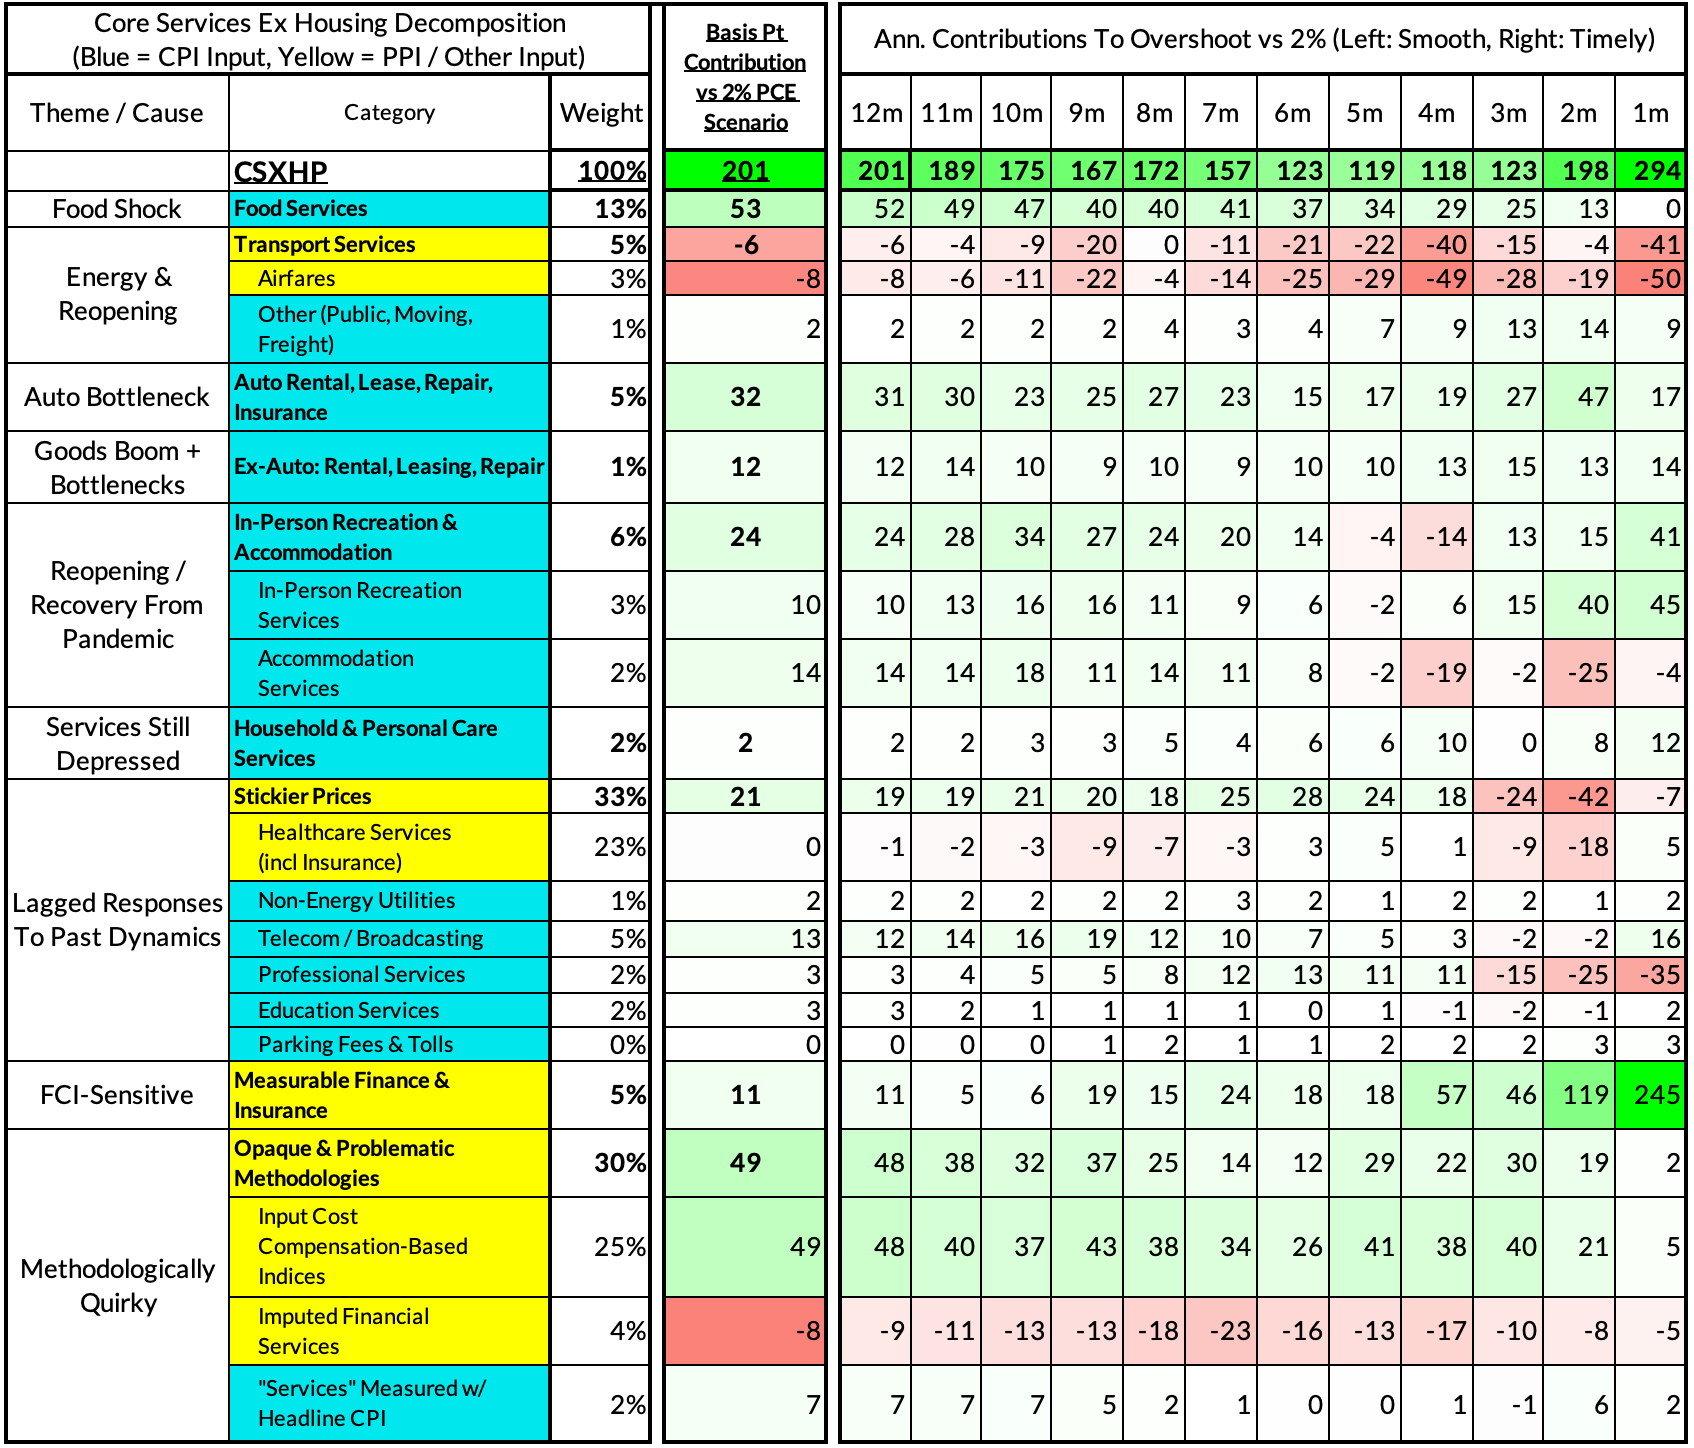
Core-Cast is our nowcasting model to track the Fed's preferred inflation gauges before and through their release date. The heatmaps below give a comprehensive view of how inflation components and themes are performing relative to what transpires when inflation is running at 2%.
Most of the Personal Consumption Expenditures (PCE) inflation gauges are sourced from Consumer Price Index (CPI) data, but Producer Price Index (PPI) input data is of increasing relevance, import price index (IPI) data can prove occasionally relevant. There are also some high-leverage components that only come out on the day of the PCE release.
Sections:
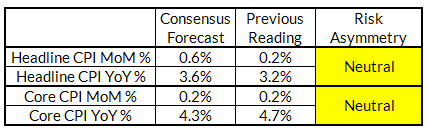
Some of the CPI downside is July will begin reversing starting in August, even as PCE dynamics improve. We see a 0.58% gain for headline CPI for August and a 0.23% increase for core CPI.
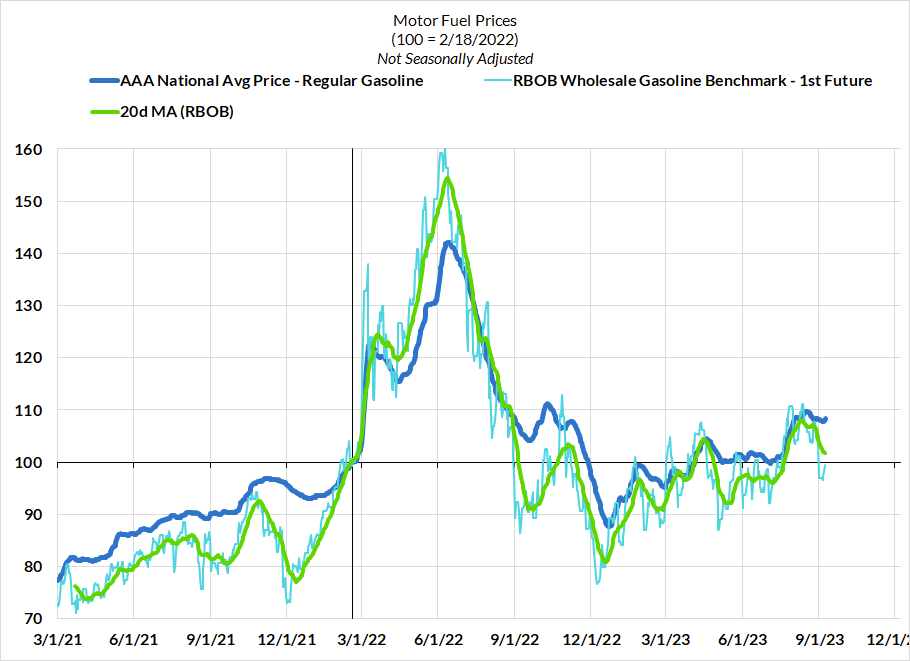
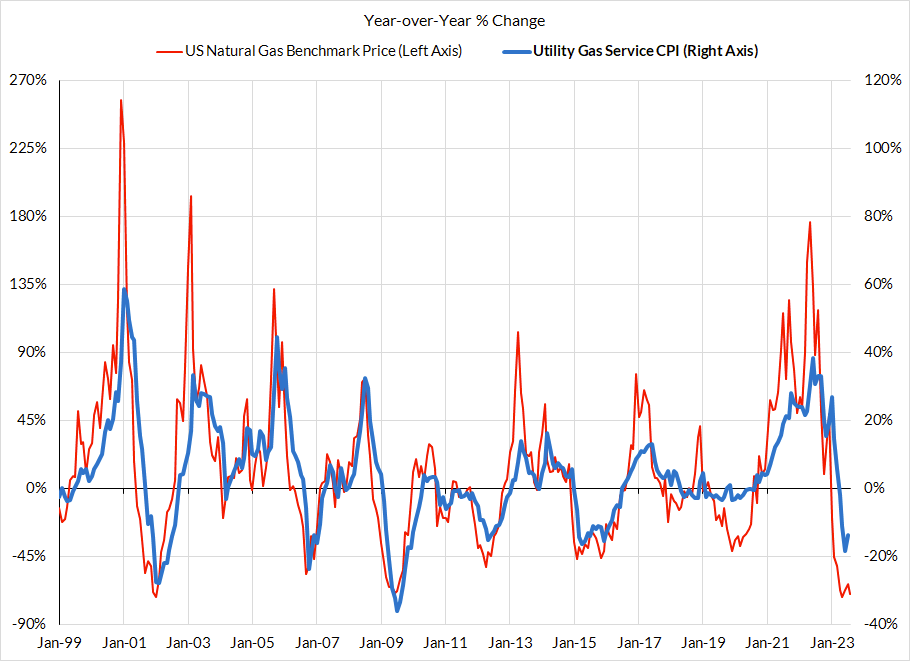
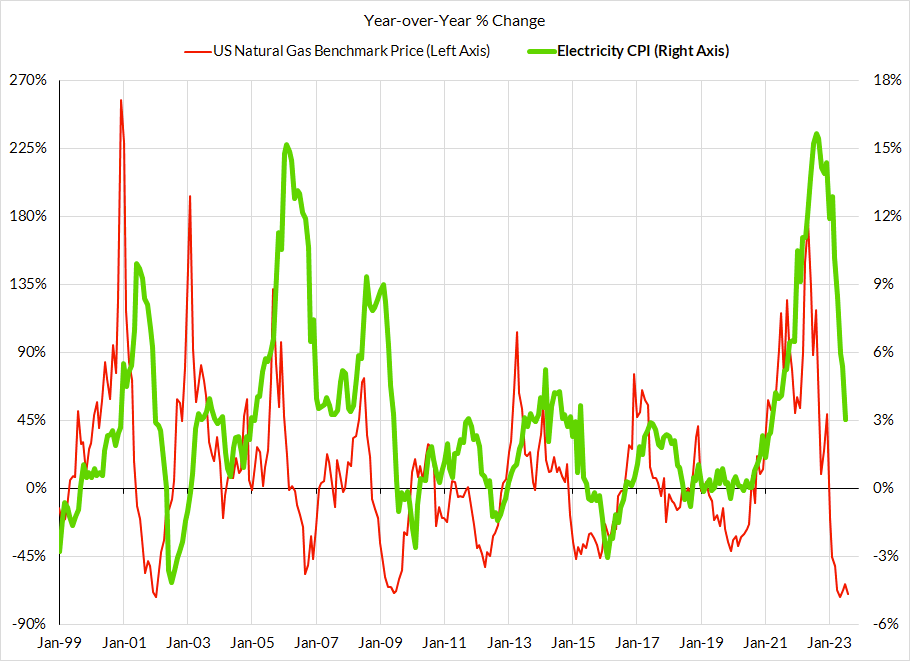
1. Headline inflation has more downside risks than core over the near-term: The headline inflation forecasting consensus tends to put high weight on gasoline price changes, which have indeed surged in the month of August. That said, food and natural gas price dynamics have local disinflationary implications that continue to be discounted. While we expected to be more optimistic about the core CPI outlook in August, the outsized downside in Airfare CPI in July now introduces upside risks to Airfare CPI in August and September. This will have take the edge off of downside risks in vehicle prices as a result of healing production levels.
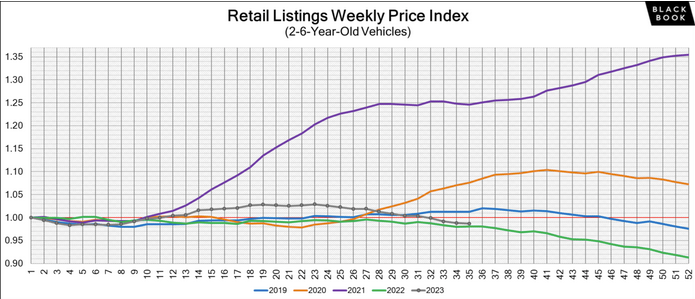
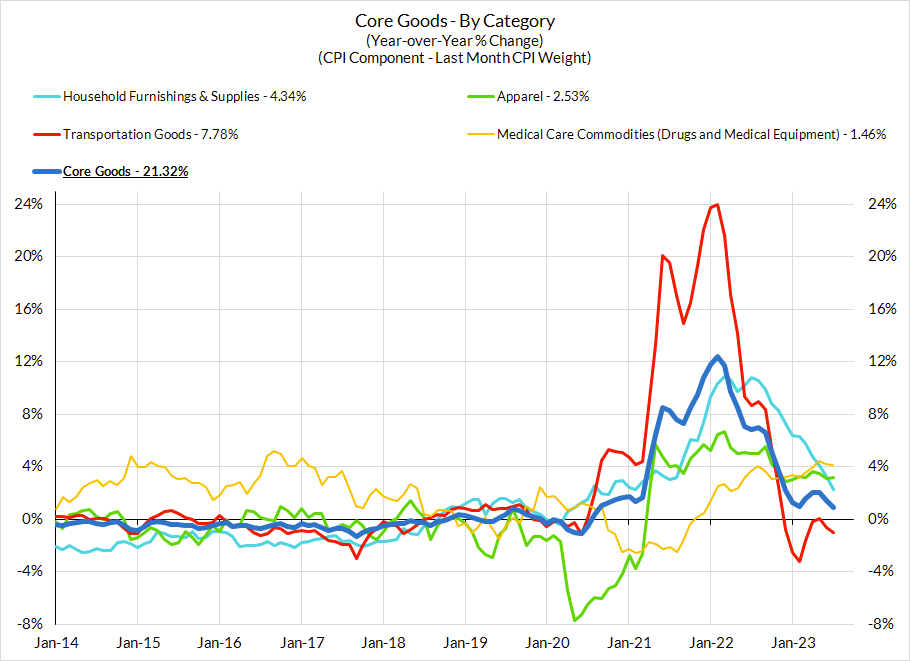
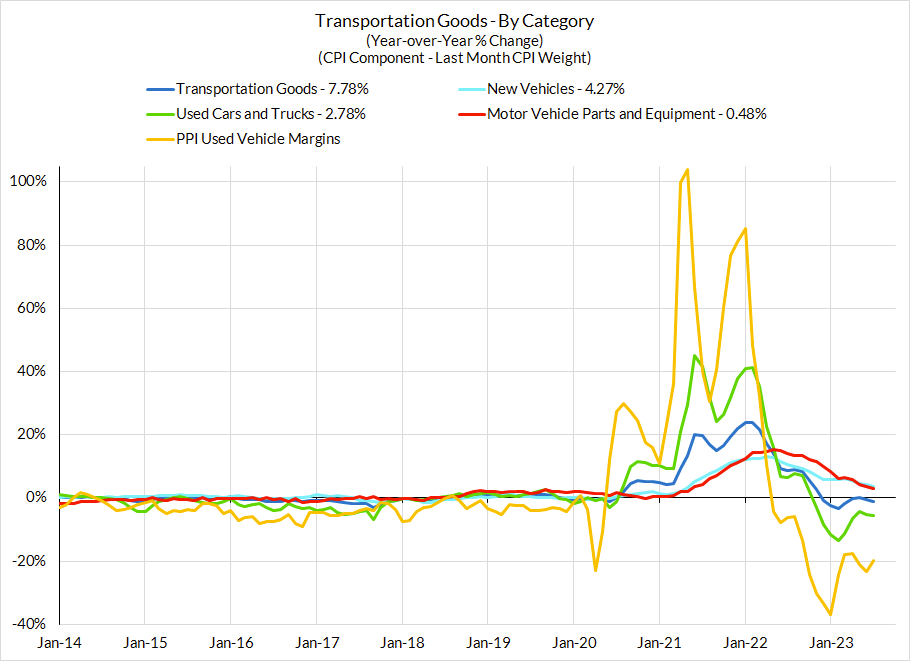
2. Used car deflation is real but the scale and speed are highly uncertain: We are confident that used car CPI should show more deflation over the near-term, but the scale feels less clear. JD Power, Manheim, and Blackbook are sending diverging signals about the scale of implied downside. This leaves us more cautious about the prospects for outsized downside in August or September.
3. For reasons discussed below, "Supercore" CPI is set to show "reacceleration" even as "Supercore" PCE decelerates: Core services ex housing CPI is primed to reaccelerate thanks to some reversion in airfares CPI and methodological quirks that will drive up health insurance CPI starting with the October release (comes out November). Neither of these have any impact on PCE inflation but will junk up the narrative about the true trajectory of Supercore and Core PCE. Ultimately, the Fed is going to stick to PCE as its gauge, even if CPI is the metric that drives news headlines and bigger market reactions.
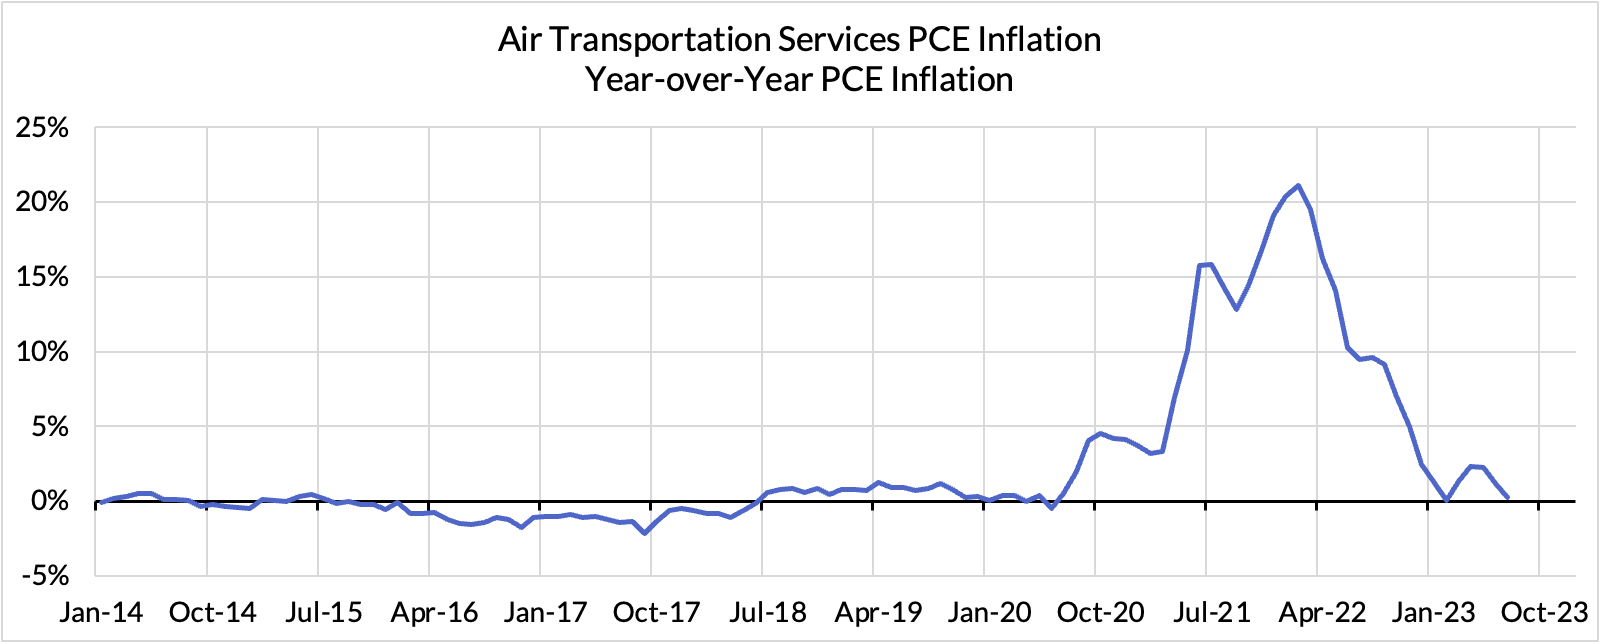
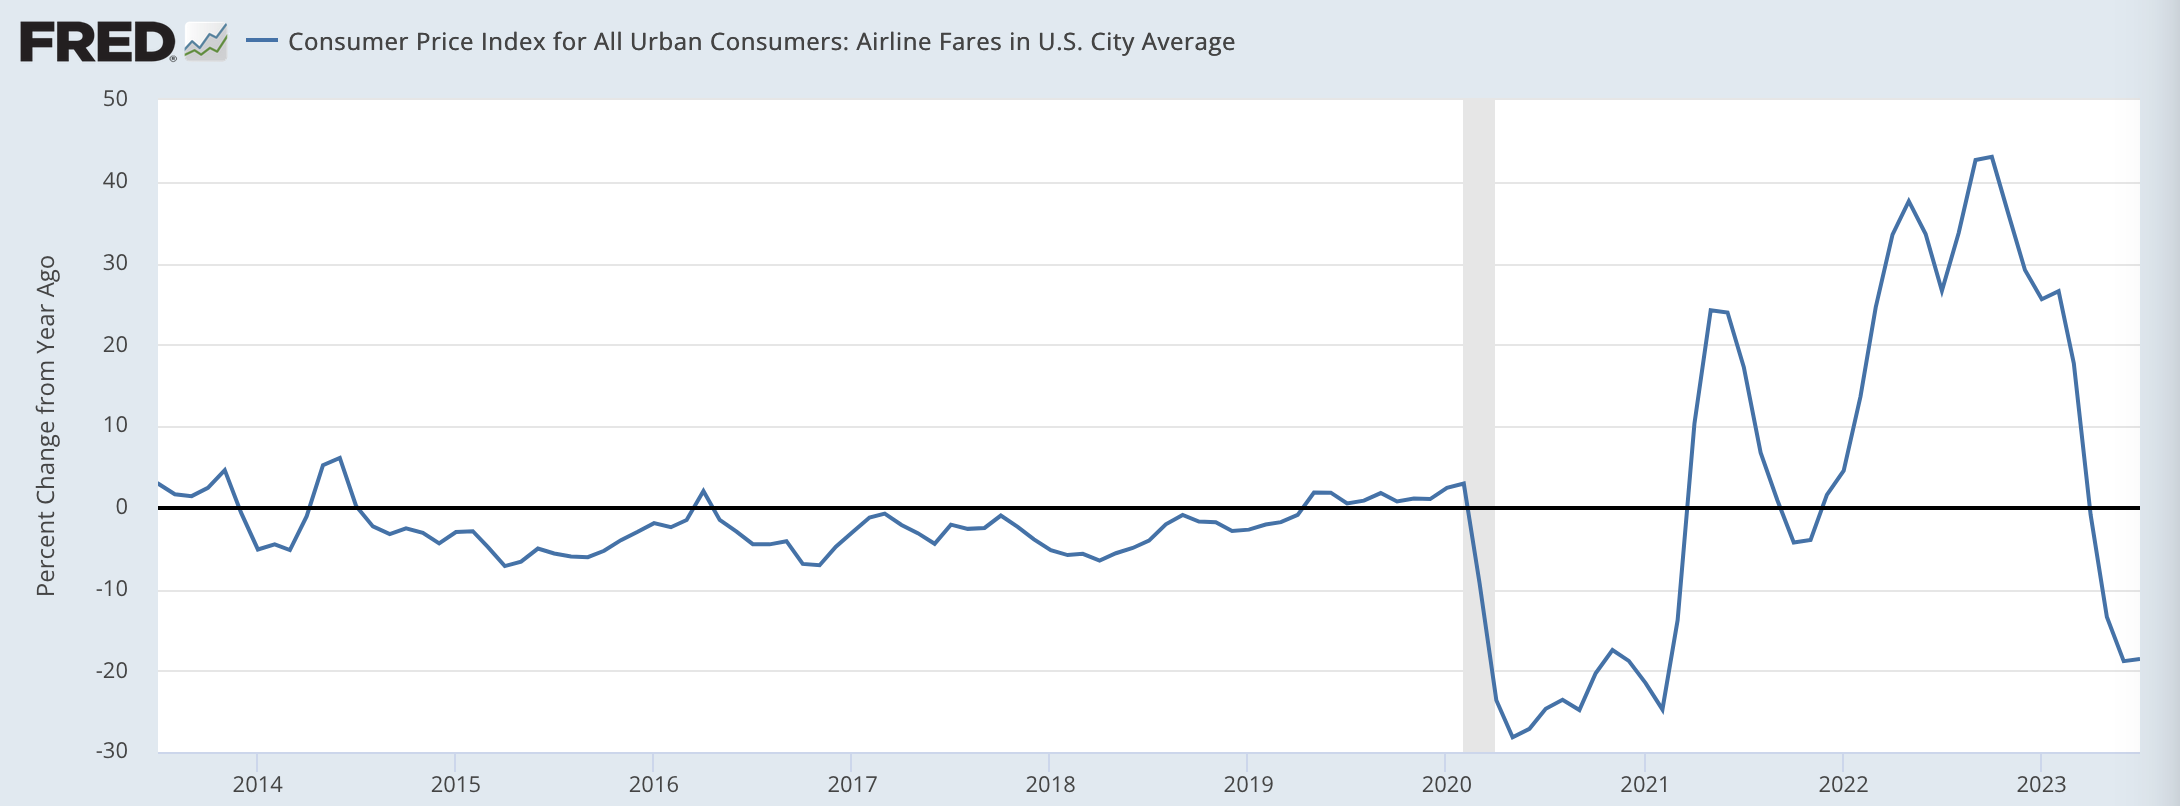
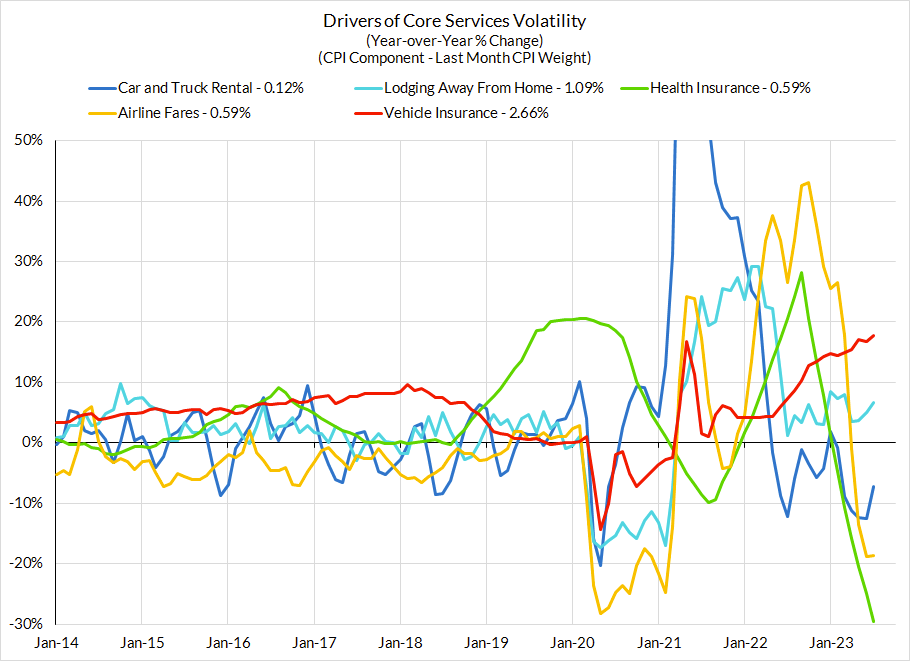
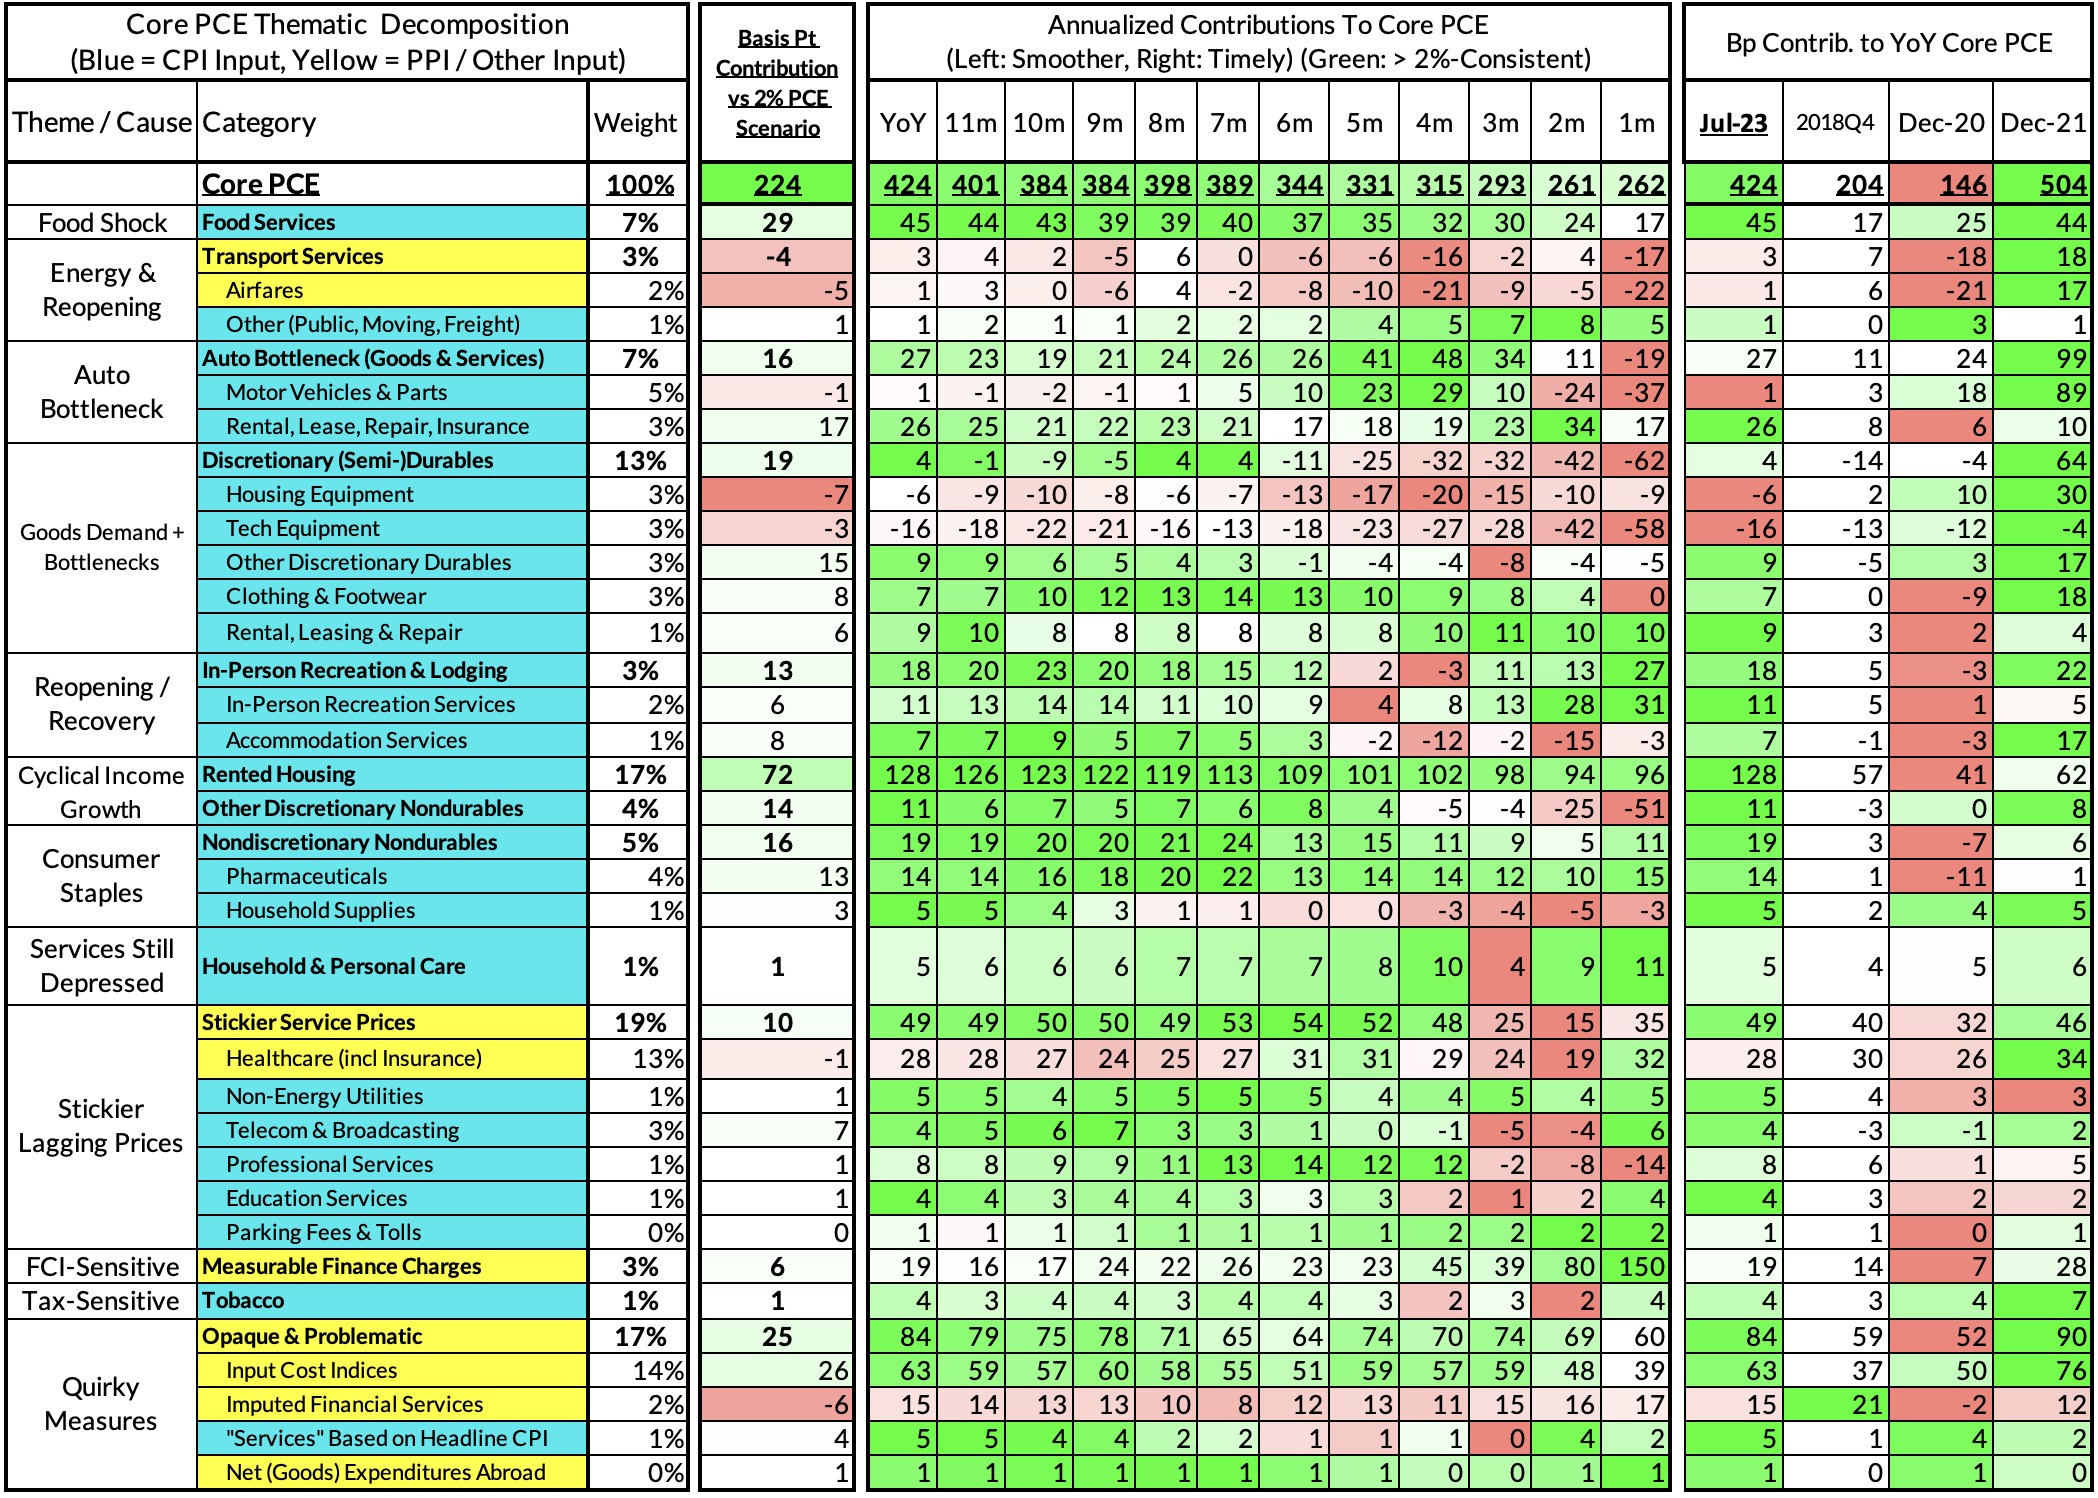
The consumer price index for airline fares has substantially deflated in the past two months even while the PCE deflator for airfares (which uses PPI and IPI inputs) has been more tame. Some of the airfare CPI deflation is set to reverse in August and September, even as we may see further deceleration in PCE. Longer term, the upside dynamic in jet fuel prices warrants further monitoring; a further upward rise could drive a second round energy passthrough impulse.
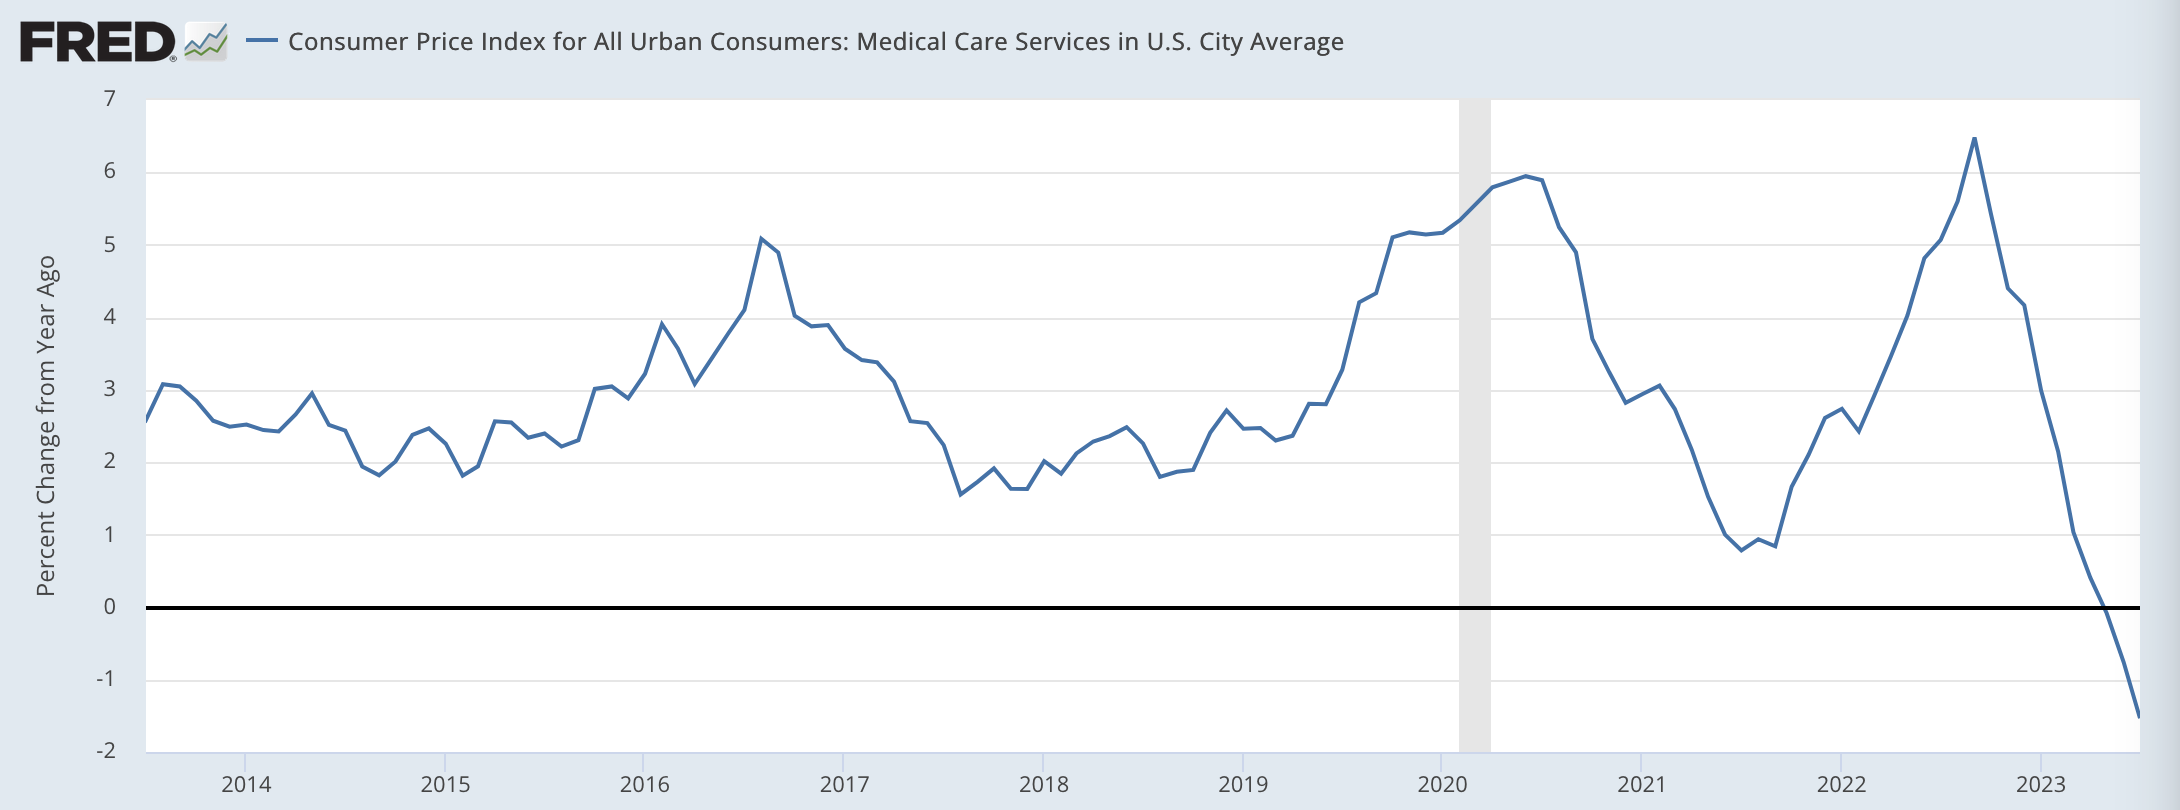
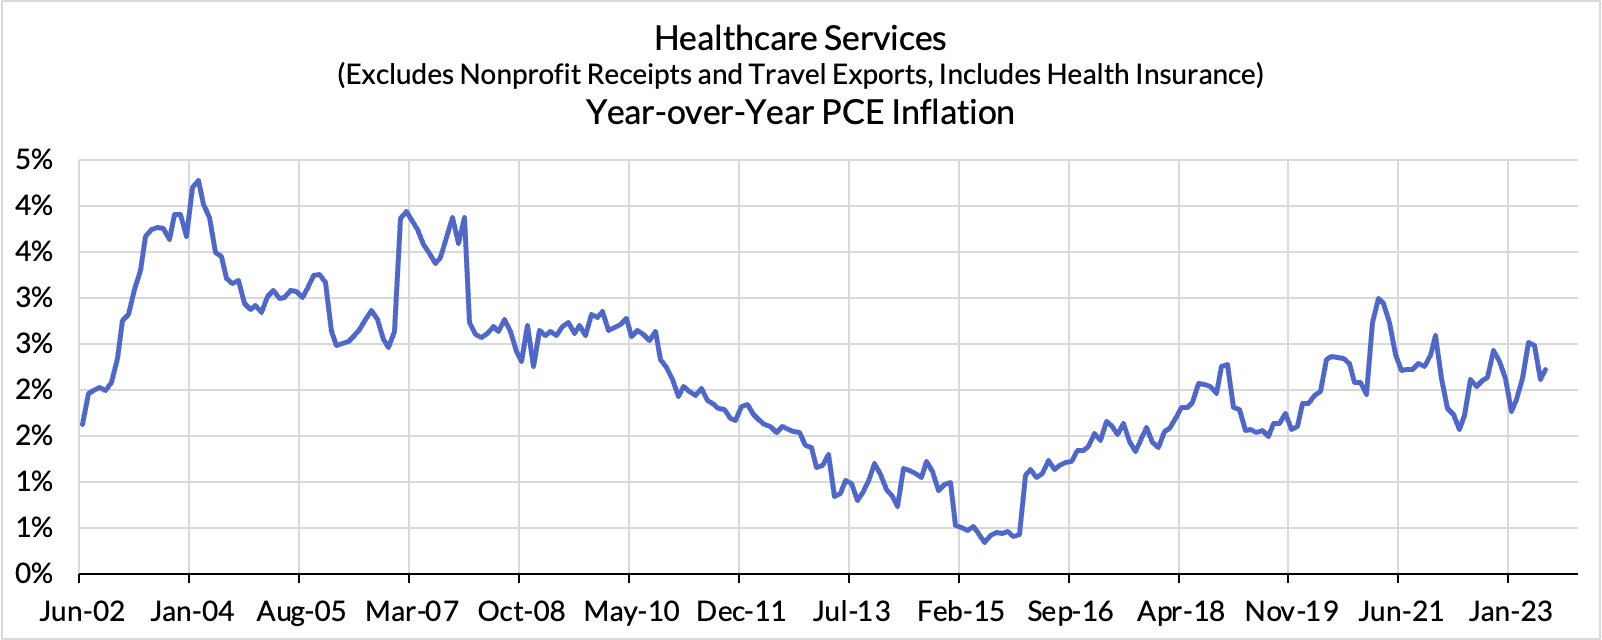
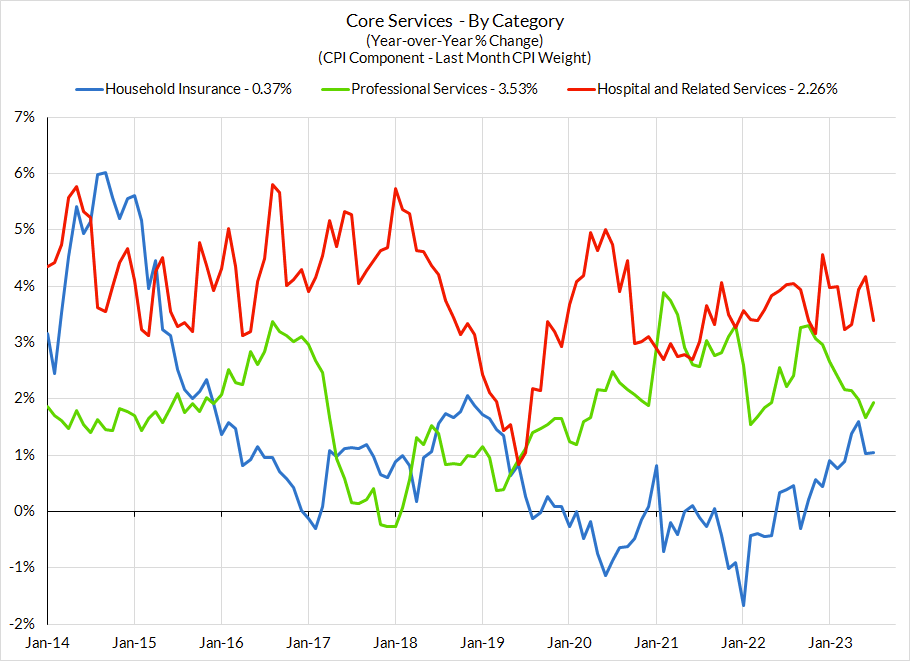
Medical insurance CPI has been a deceptive source of CPI and "supercore CPI" deceleration that has otherwise been totally irrelevant to PCE outcomes. The methodology used here tends to drive locally similar outcomes until new annual data causes "jump" effects in October to a new local trend in price growth. The BLS has tried to remedy some of this "jump" effect but it will still drive a snowballing in supercore CPI and core CPI acceleration from the October CPI release onwards. If the Fed is not attentive to this distortion, acceleration visible in the October and November CPI releases could complicate communications headed into the December FOMC meeting. Healthcare services PCE inflation has been increasingly well-behaved over the course of a year when it could have driven more upside; if Congress holds the line at the end of the year, we could see further disinflation in 2024.
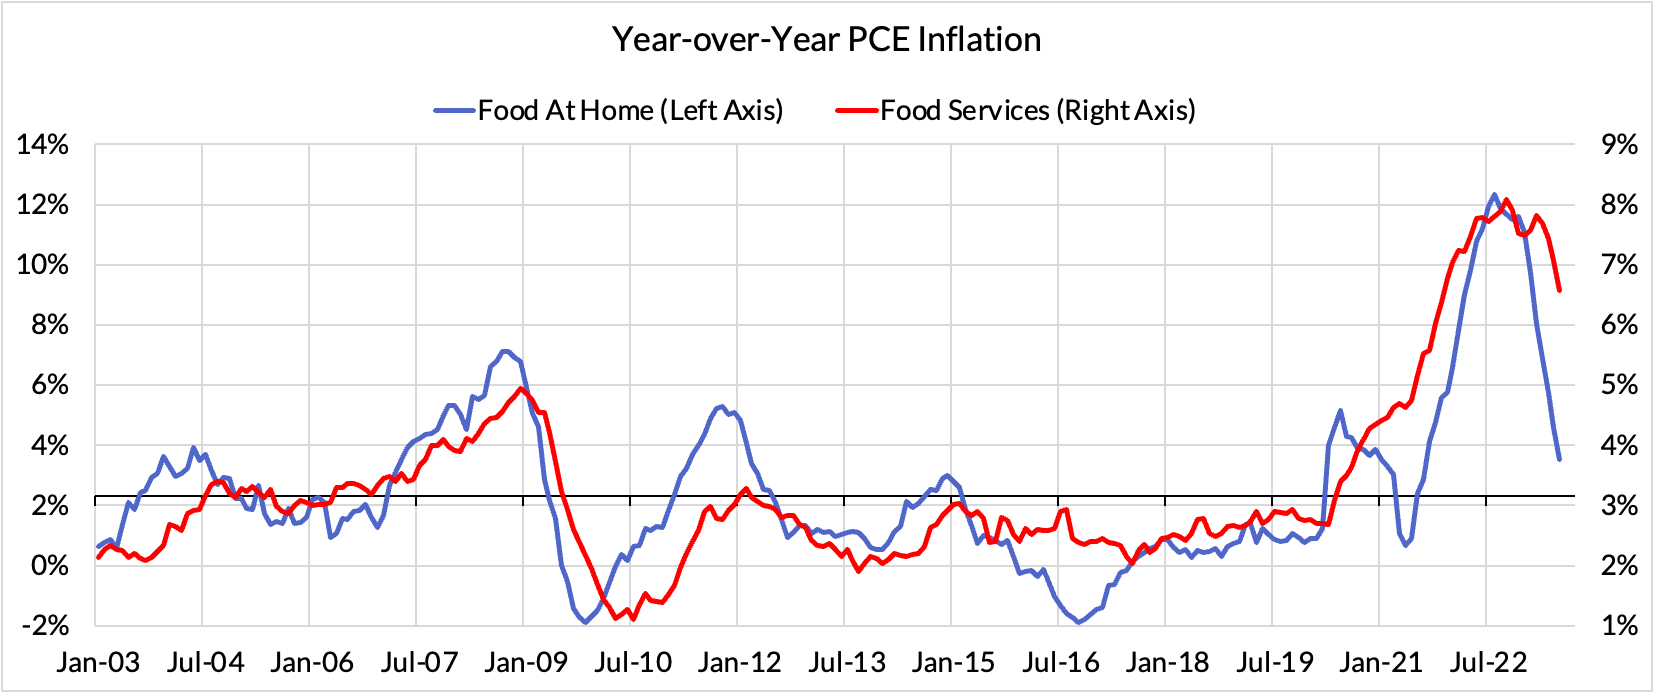
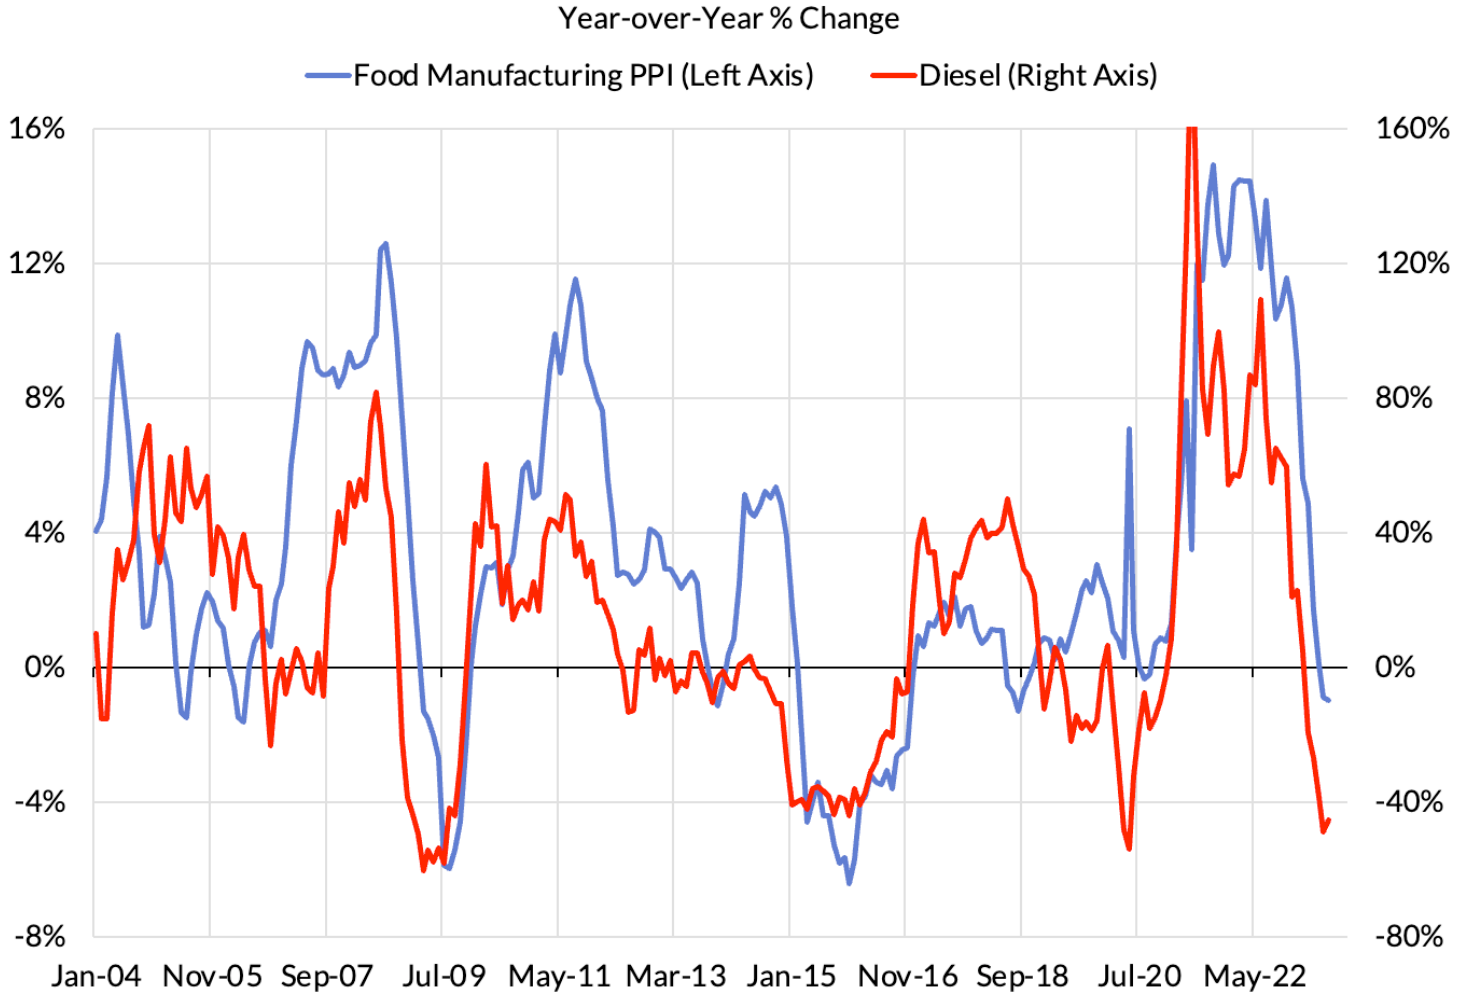
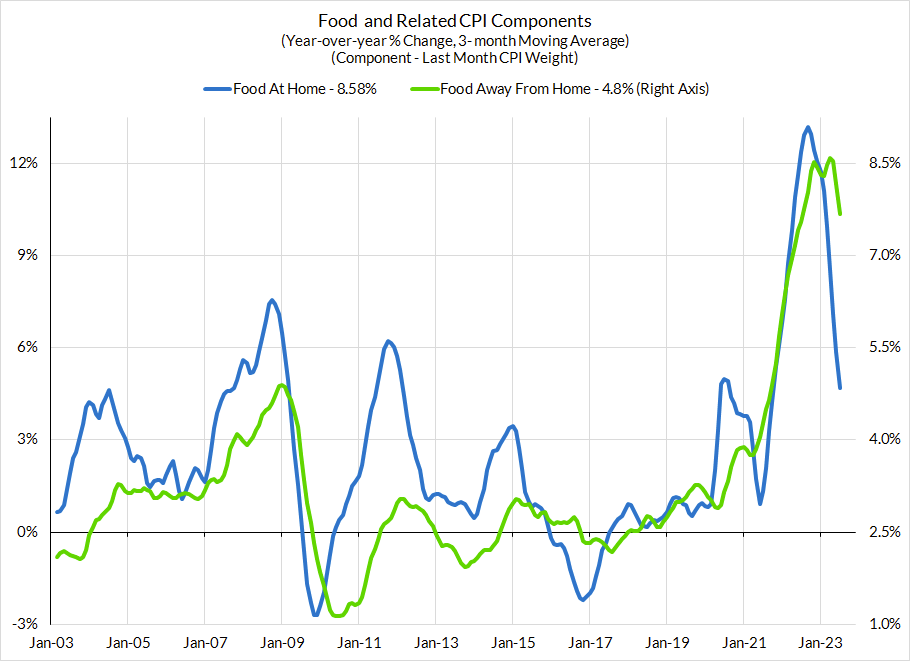
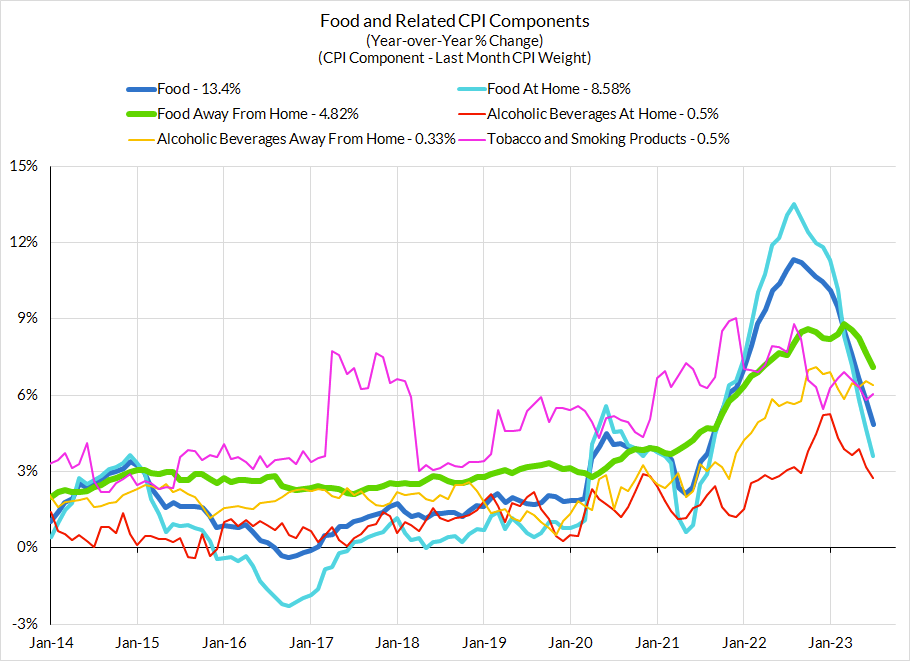
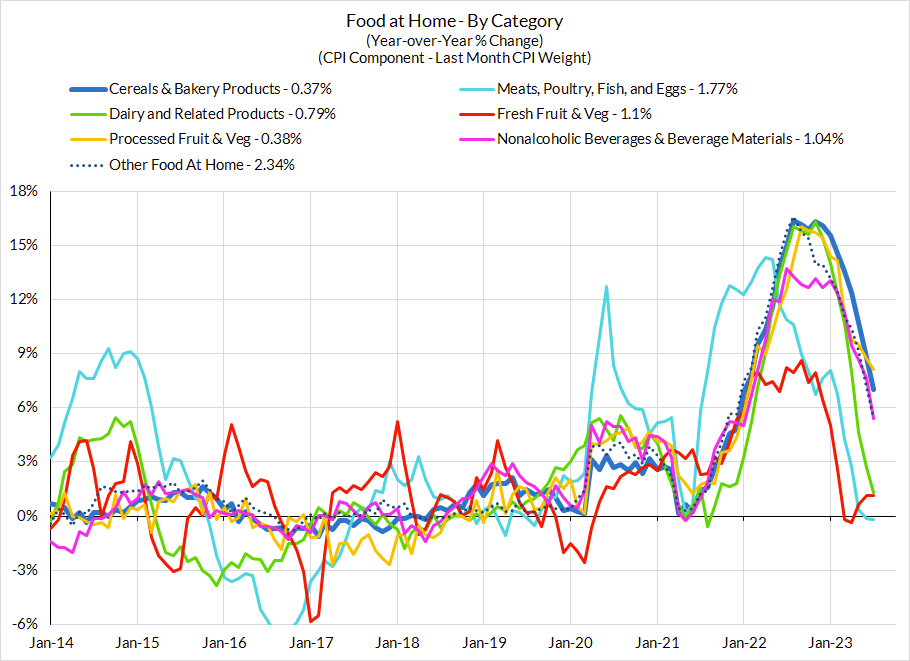
Food services inflation is excluded from core CPI, but included in Headline CPI and Core PCE. Food services inflation has been decelerating in the past couple of quarters, lagging the general deceleration in food prices, which lags the general deceleration in diesel price inflation. It's a key source of optimism with respect to Supercore PCE outcomes (where food services inflation is a substantial contributor to the year-over-year overshoot). But core CPI doesn't capture any of this progress and can thus deceive about the true state of Core PCE progress on CPI day. Here too, the risk of an upside spike to refined product prices could yield a positive second-round impulse to core inflation.
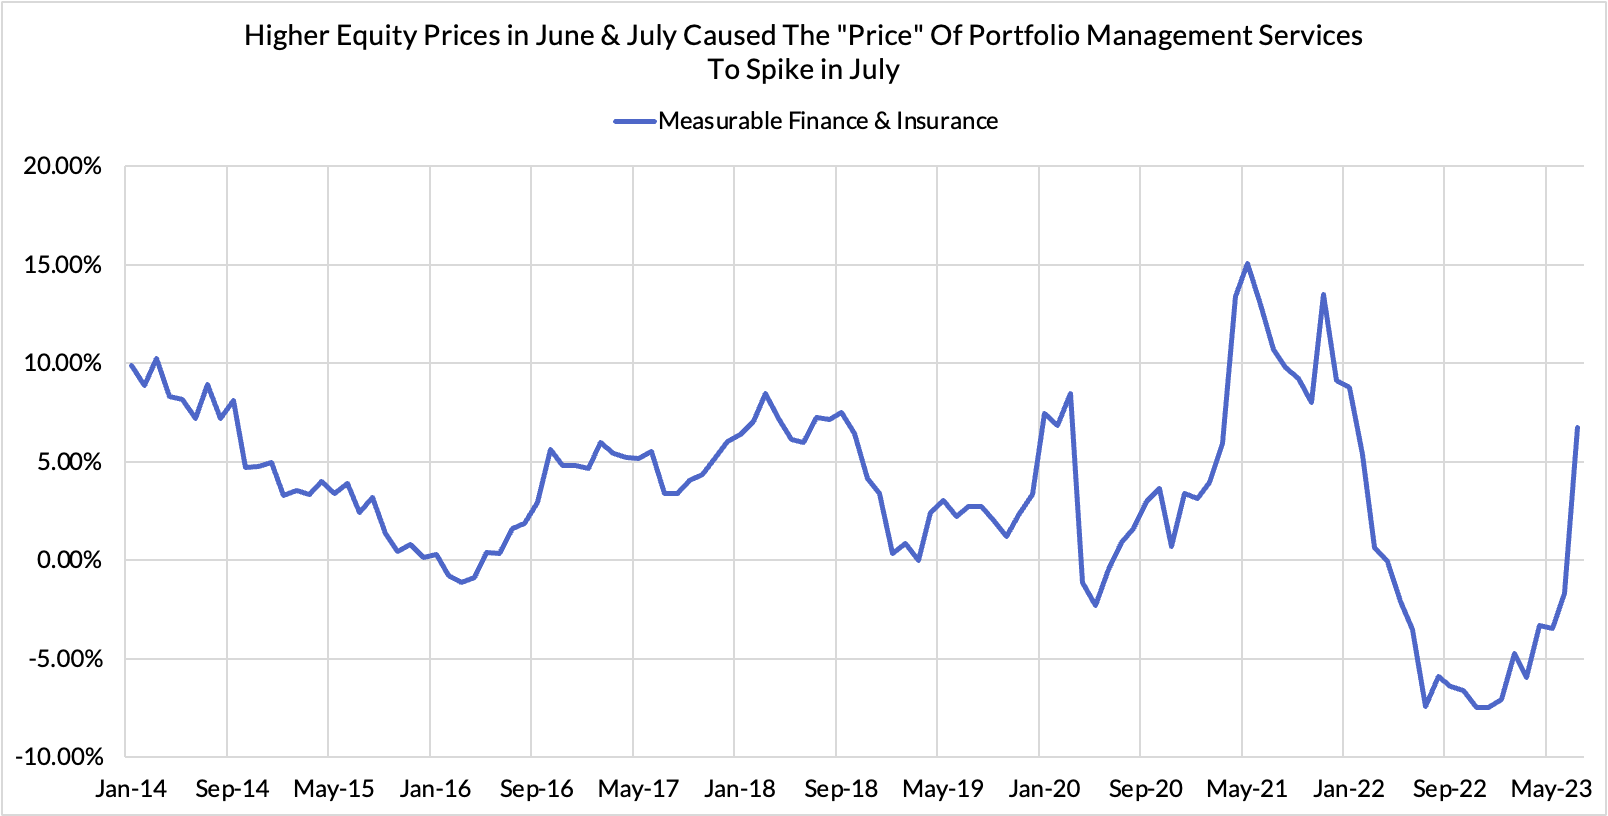
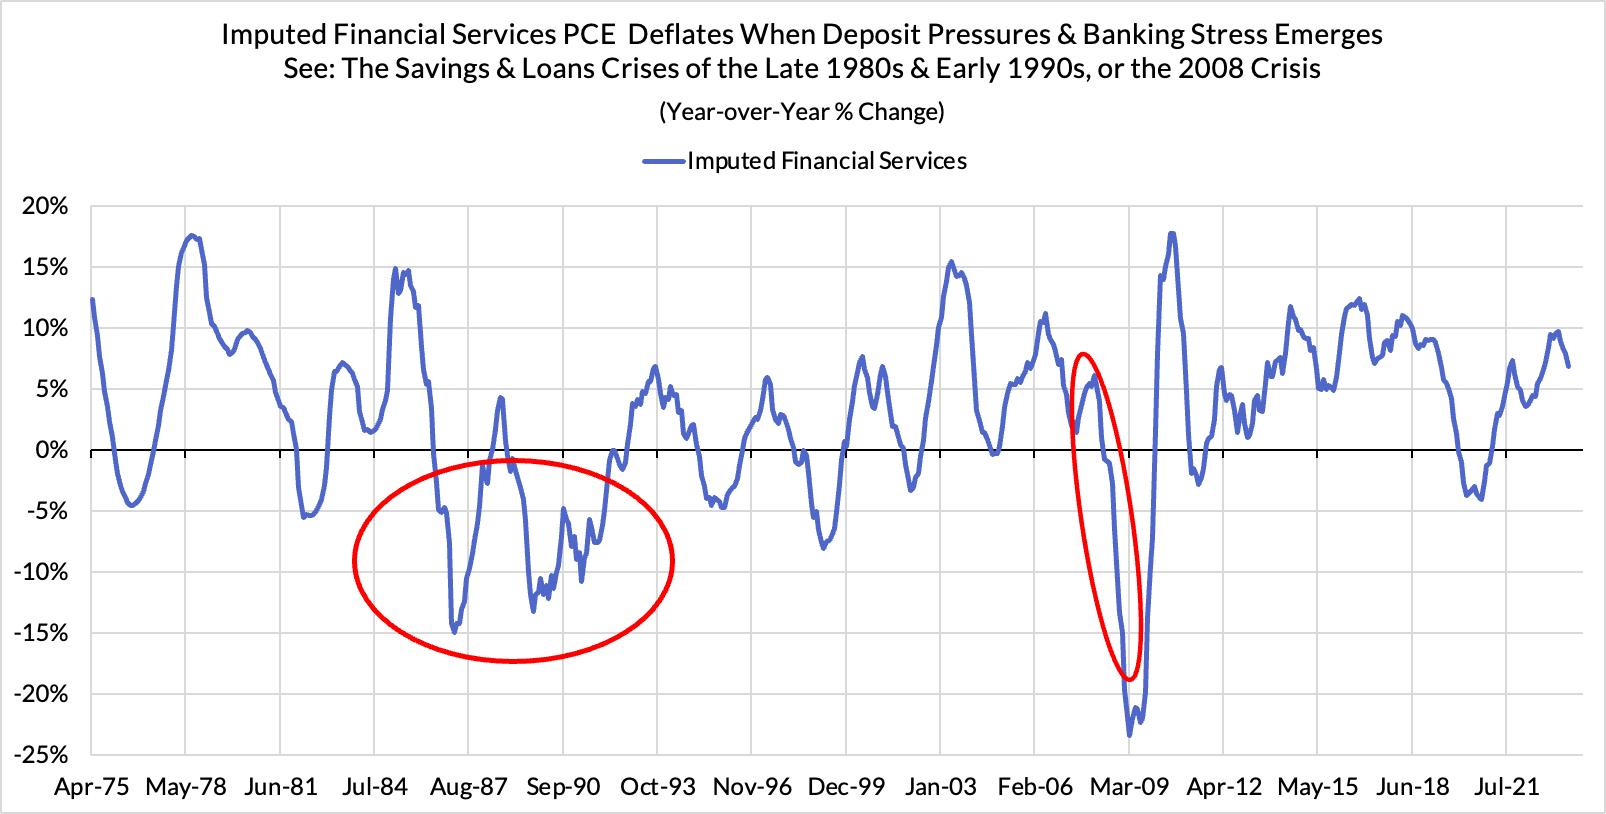
Financial services components of CPI are of trivial relevance to CPI and PCE, but there are financial services PCE components of elevated relevance. The June-July run up in equity prices caused a spike in portfolio management prices in July PCE, pushing up the subaggregate the Fed misguidedly attributes to labor market dynamics. This spike was higher than what stock prices alone would predict but should calm down on a forward-looking basis, barring a true melt-up in equity prices. Imputed financial services PCE inflation is more sensitive to the spread between deposit rates and the Fed Funds Rate, and is also decelerating more meaningfully now as a result (this process is difficult to observe because estimates get heavily revised month to month).
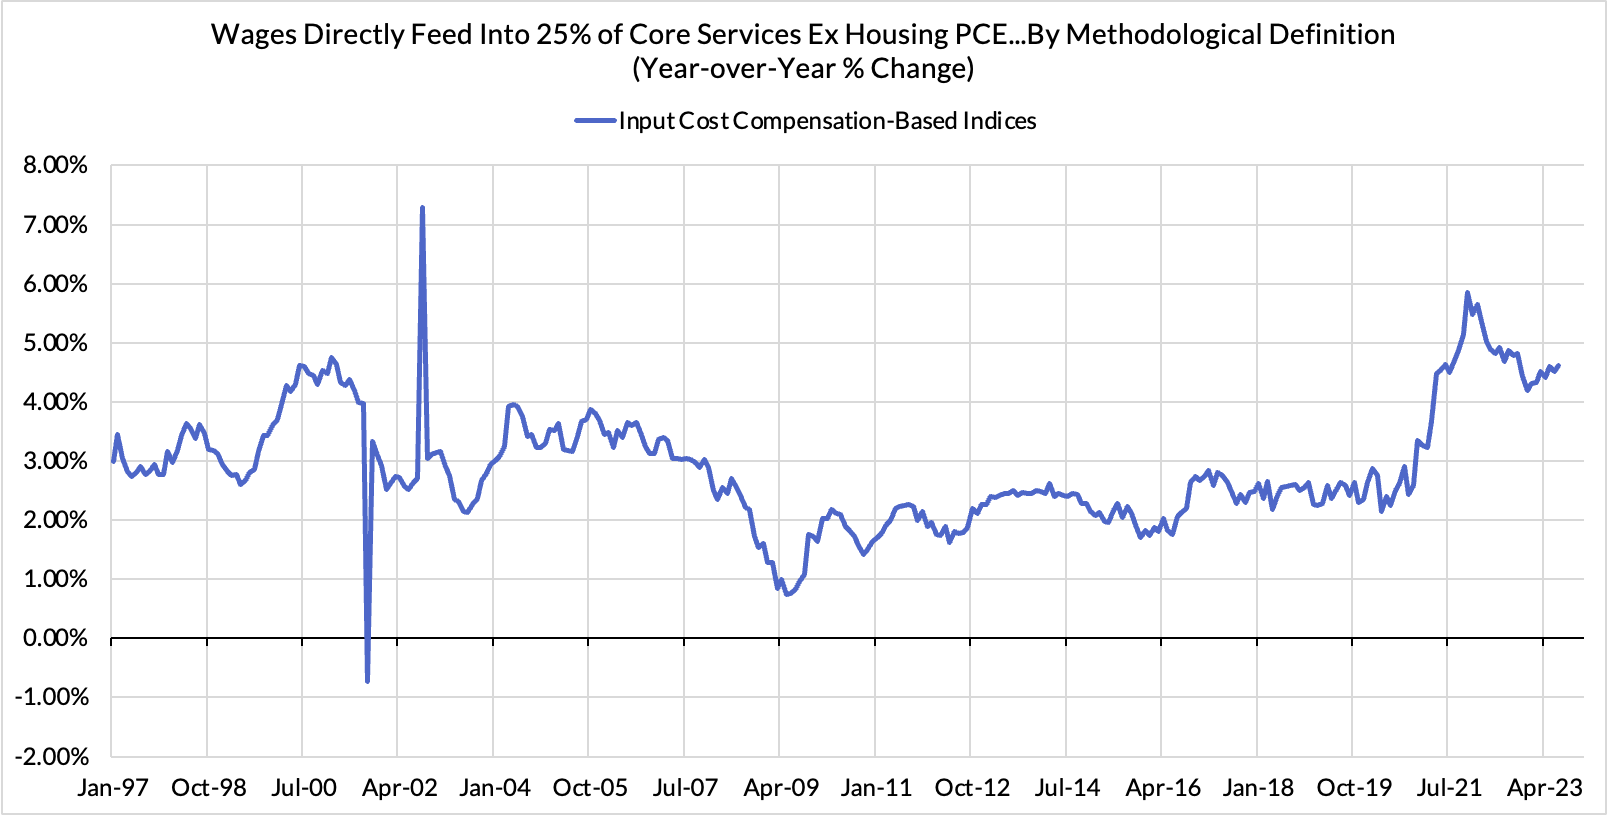
There is a one particular segment of "Core Services Ex Housing" (Supercore) PCE that is driven directly by labor market dynamics, and wage data in particular. For many parts of consumption where no transacted price is observed, the Fed uses wage-based input cost indices. Wages have been decelerating and judging by the ongoing decline in the quits rate, should continue to decelerate. While the year-over-year readings look to be upward sloping, the local trend on a monthly annualized basis looks more encouraging (see heatmaps below).
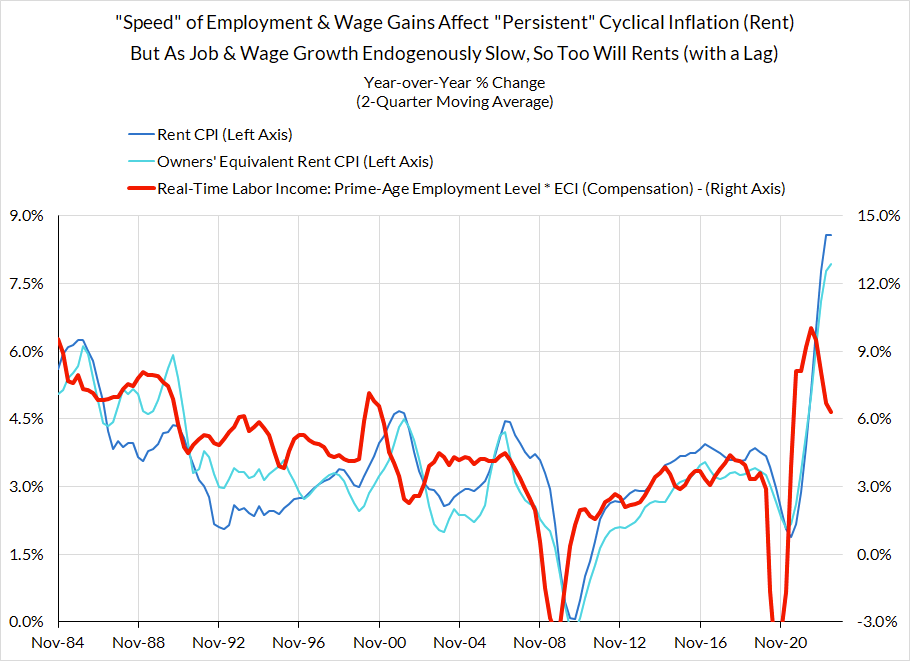
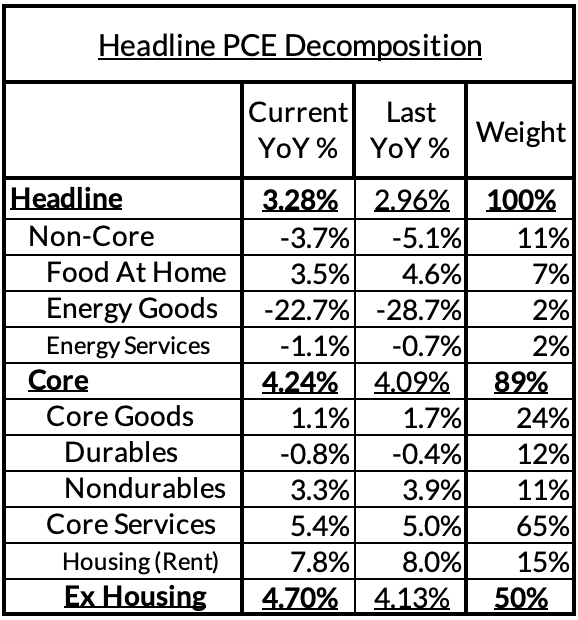
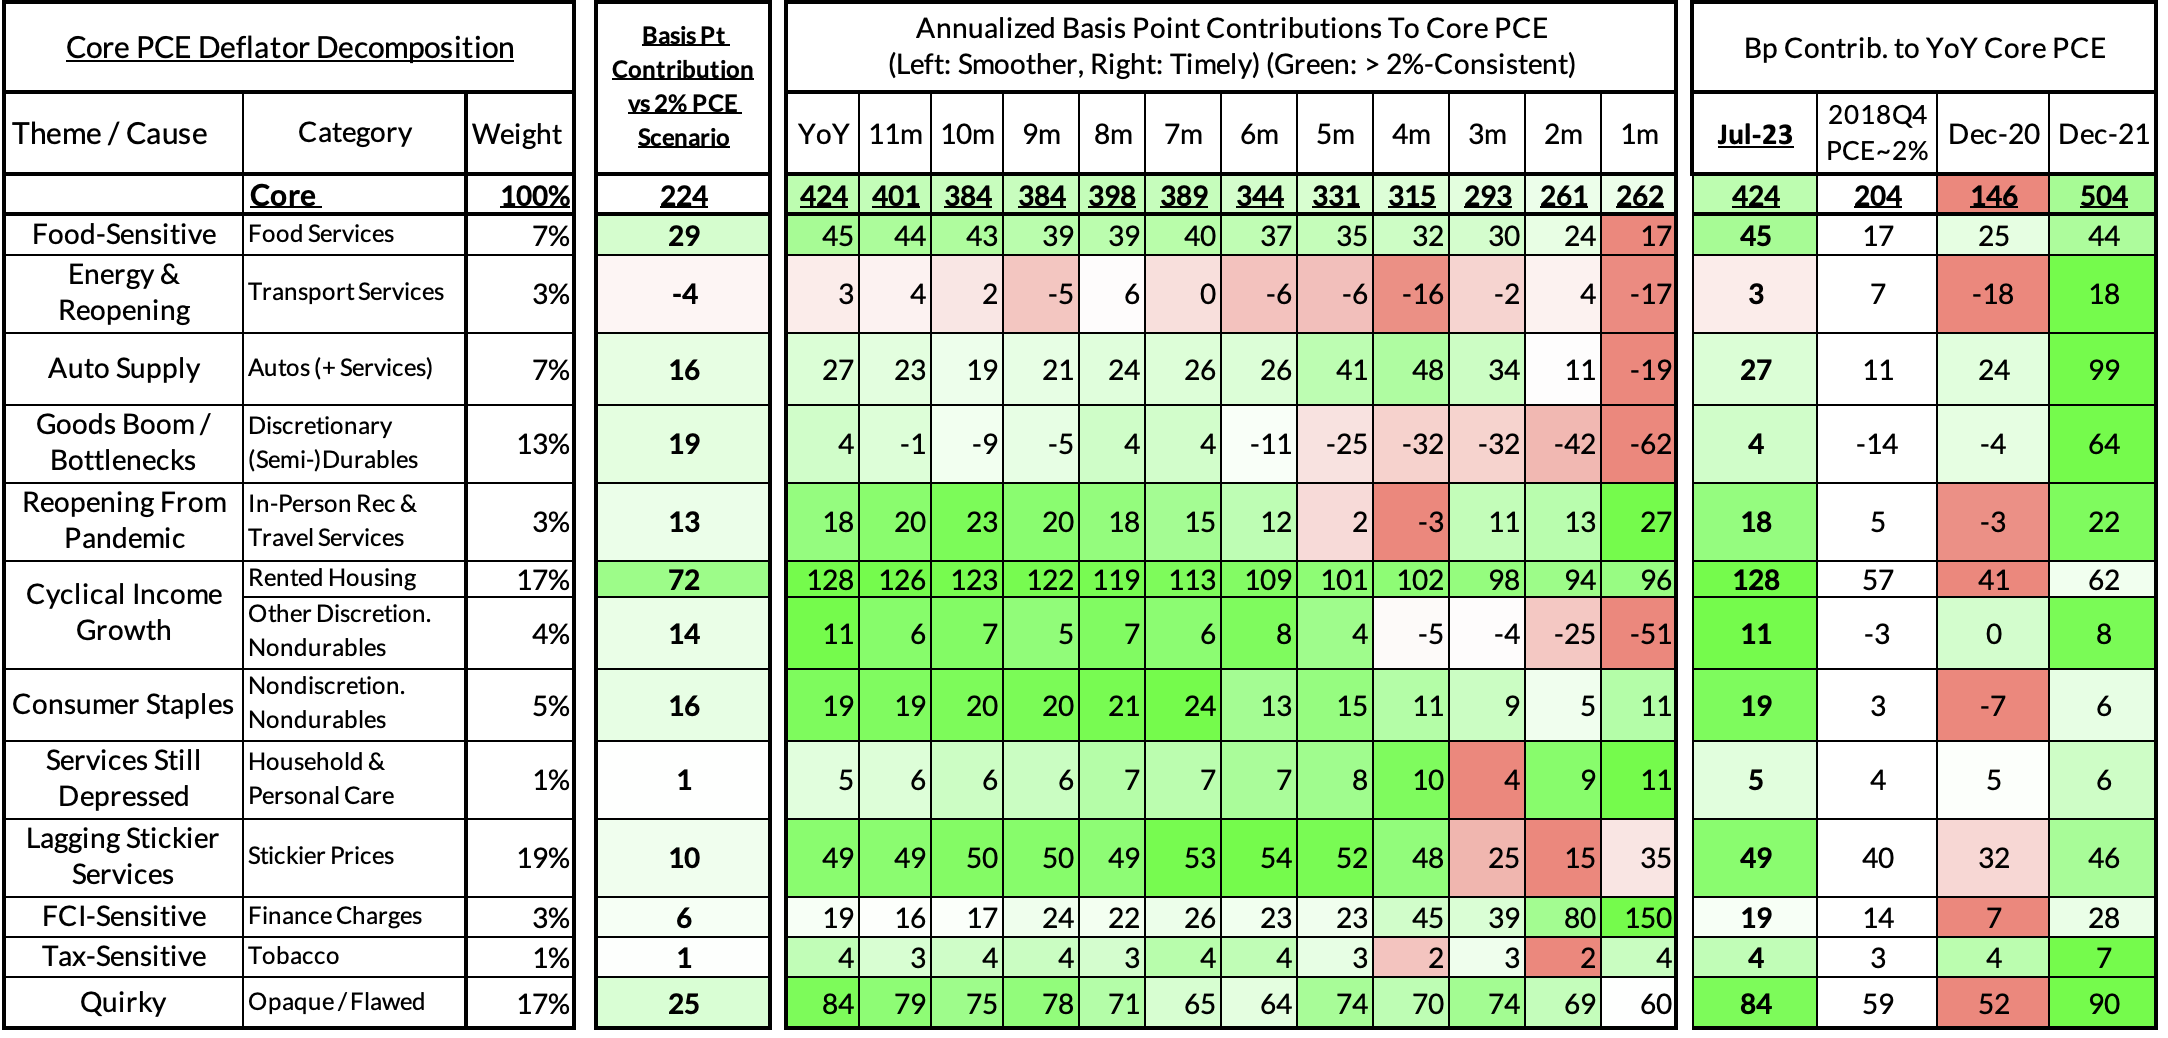
Right now Core PCE (PCE less food products and energy) is running at a 4.24% as of July, 224 basis points above the Fed's 2% inflation target for PCE. That overshoot is disproportionately driven by catch-up rent CPI inflation in response to the surge in household formation (a byproduct of rapidly recovering job growth) and market rents in 2021-22. Rent is contributing 72 basis points to the 224 basis point core PCE overshoot.
There are other contributors to the overshoot:
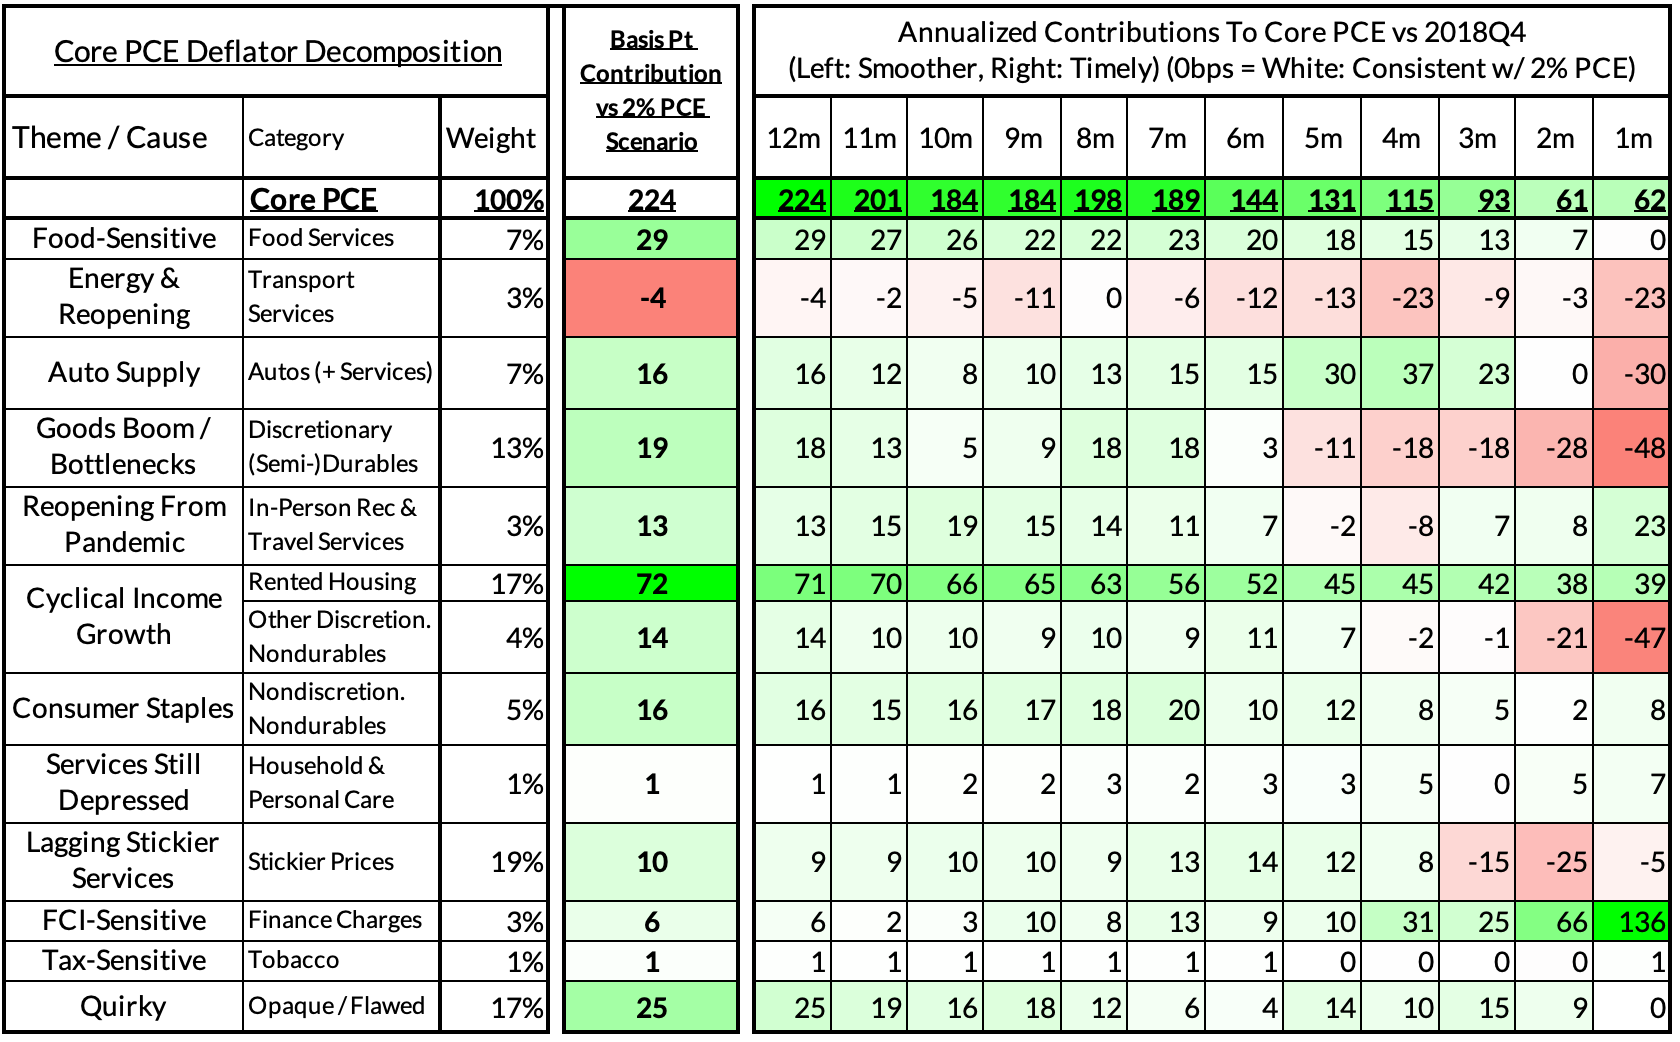
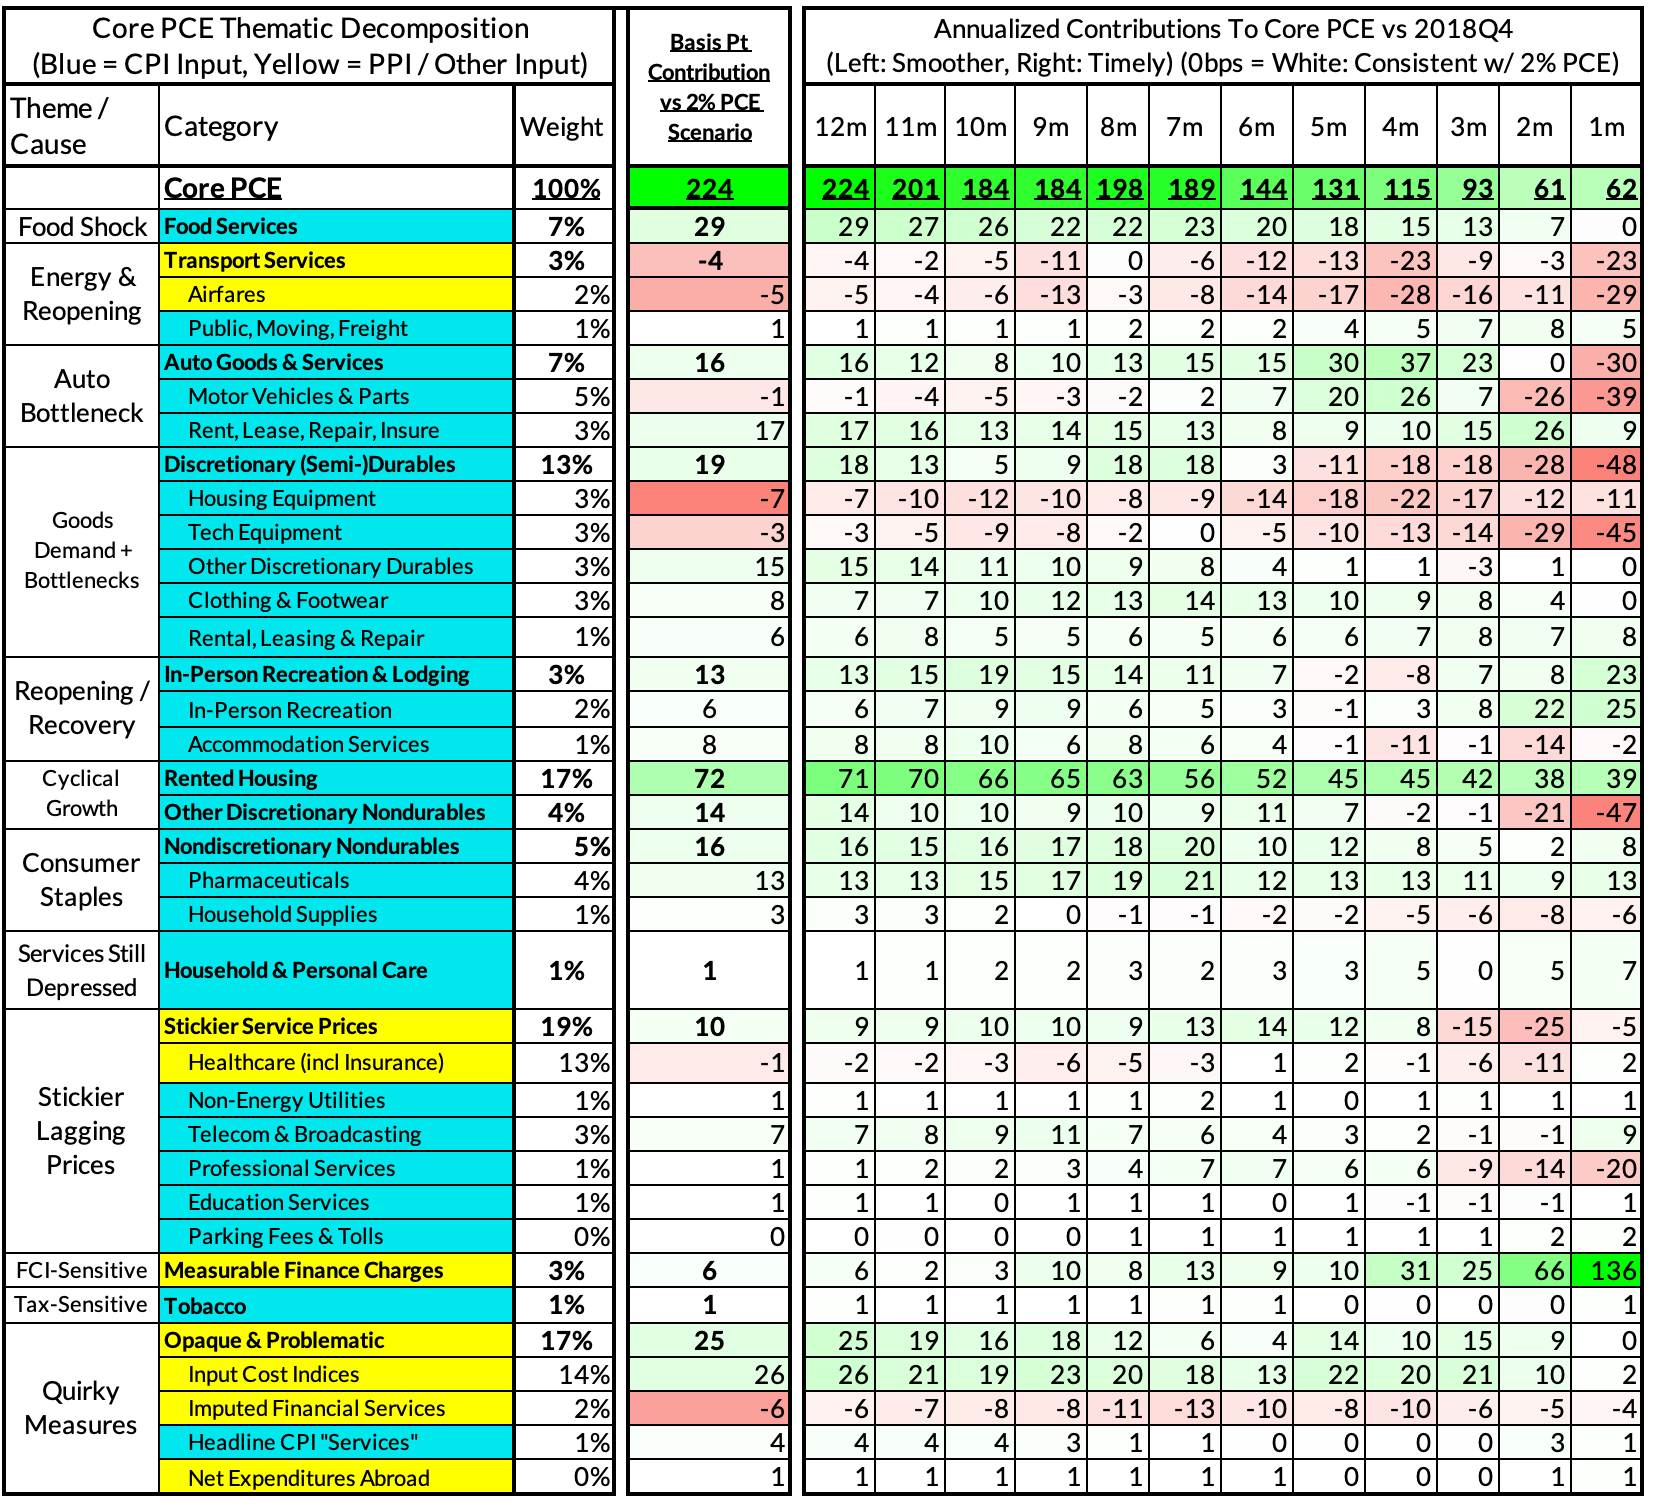
The final two heatmaps of this section give you a sense of the overshoot on shorter annualized run-rates. Monthly annualized core PCE in July yielded a 2.62% now likely yields a 62 basis point overshoot vs 2% target inflation (2.62% annualized).
The July growth rate in "Core Services Ex Housing PCE" ran at 4.70%, a 202 basis point overshoot versus the 2.68% run rate that coincided with ~2% headline and core PCE.
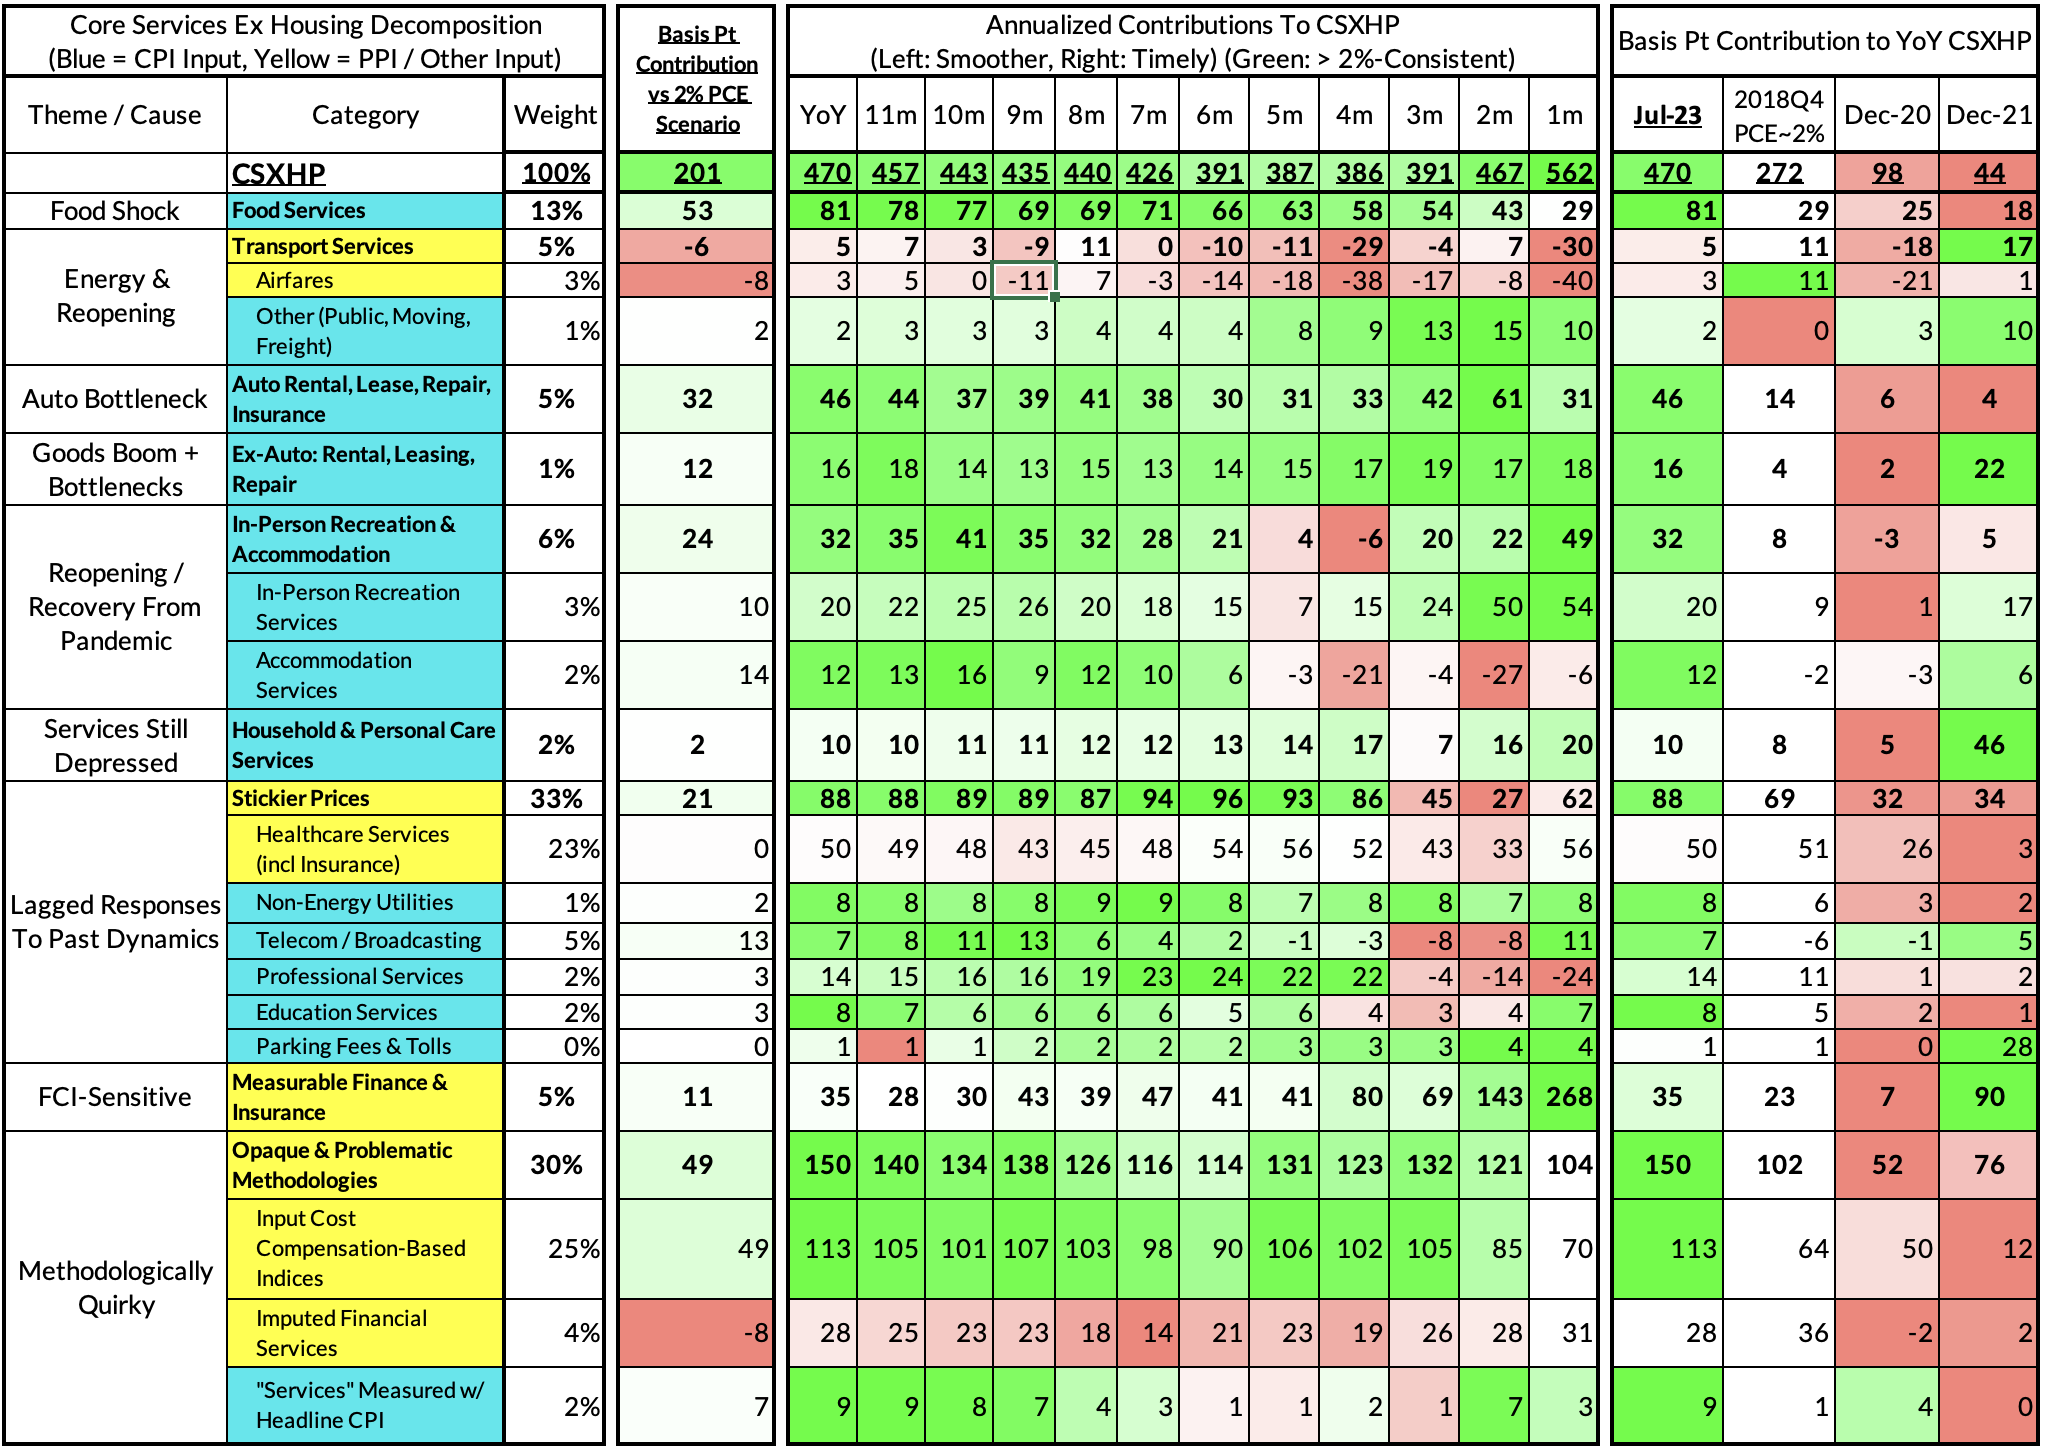
The momentum for deceleration in this subaggregate of PCE has been temporarily arrested by a surge in portfolio management and investment advisory prices. July monthly CSXHP ran at a 5.62% annualized rate, a 294 basis point overshoot of what would be consistent with 2% headline and core PCE. Over the coming months, we should see more progress as PCE-specific idiosyncraasies abate (and even as CPI-specific idiosyncrasies ramp up).