An odd schedule of inflation releases this month, with PPI preceding CPI, makes for a more belated process for updating of our nowcasts carefully.
Core-Cast is our nowcasting model to track the Fed's preferred inflation gauges before and through their release date. The heatmaps below give a comprehensive view of how inflation components and themes are performing relative to what transpires when inflation is running at 2%.
Most of the Personal Consumption Expenditures (PCE) inflation gauges are sourced from Consumer Price Index (CPI) data, but Producer Price Index (PPI) input data is of increasing relevance, import price index (IPI) data can prove occasionally relevant. There are also some high-leverage components that only come out on the day of the PCE release.
Summary: PCE Nowcasts & CPI Forecasts
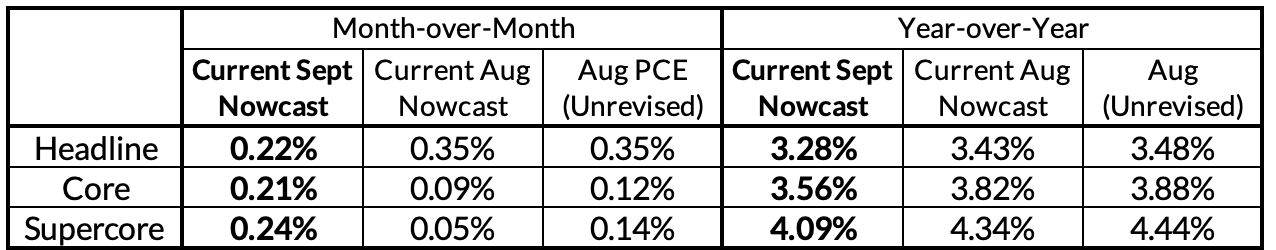
We have been warning for some time now that the "wedge" between Core CPI and Core PCE would matter and today's information further confirms this dynamic. Thanks to a combination of general disinflationary trends and downside revisions to the August PPI readings, Core PCE is on track to show further underperformance relative to the Fed's projections thanks to a downward revision to August airfare data. There are still plenty of data in tomorrow's CPI release that will reshape our nowcasts, but we retain our warning that Core CPI can look "optically hot" even as there is further progress towards the Fed's inflation goals. The median FOMC member projected that Core PCE would finish the year at 3.7%; even if Core CPI is a firm 0.3% for September, Core PCE can run at 3.6% for September.
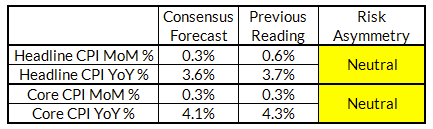
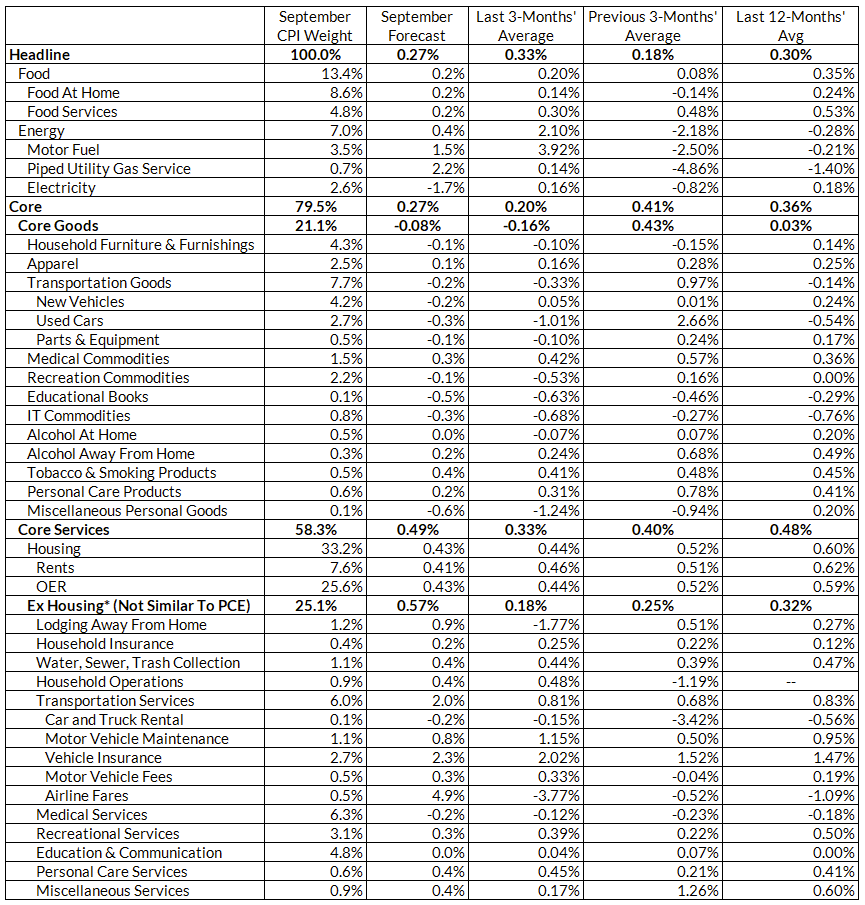
Core CPI and Supercore CPI are poised to deliver further acceleration in September, but will have limited implications for PCE inflation. We have no major divergence vs consensus as a result. CPI will run hot due to vehicle insurance, airfares, and possibly healthcare services, alongside a correction to lodging prices. We currently forecast that Core CPI to run a 0.27% and Supercore CPI to run at 0.49%; both are likely to be red herrings for understanding the implications of the CPI release for the Fed's central inflation aggregates.
Key Dynamics Within Baseline View
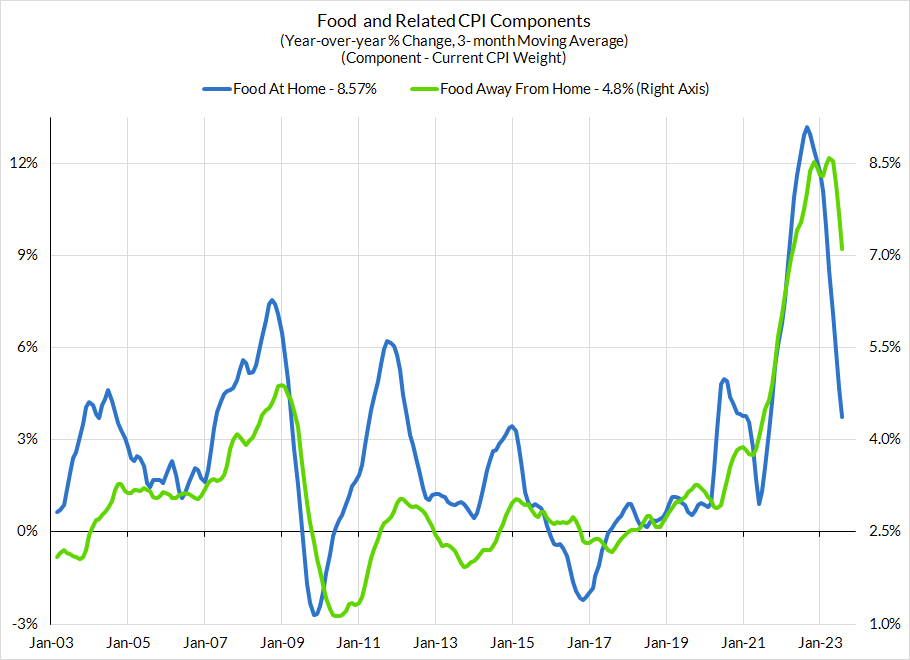
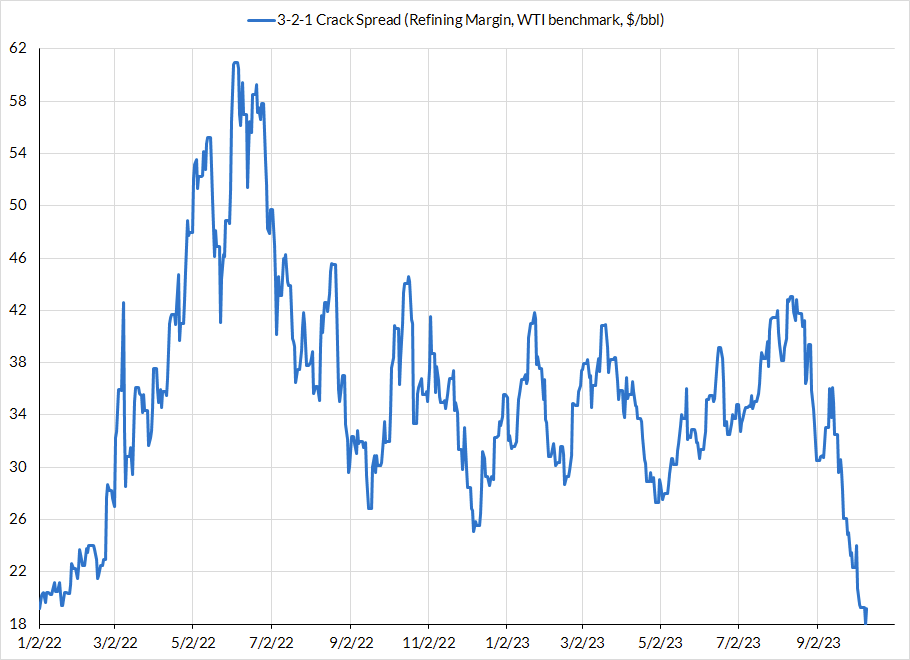
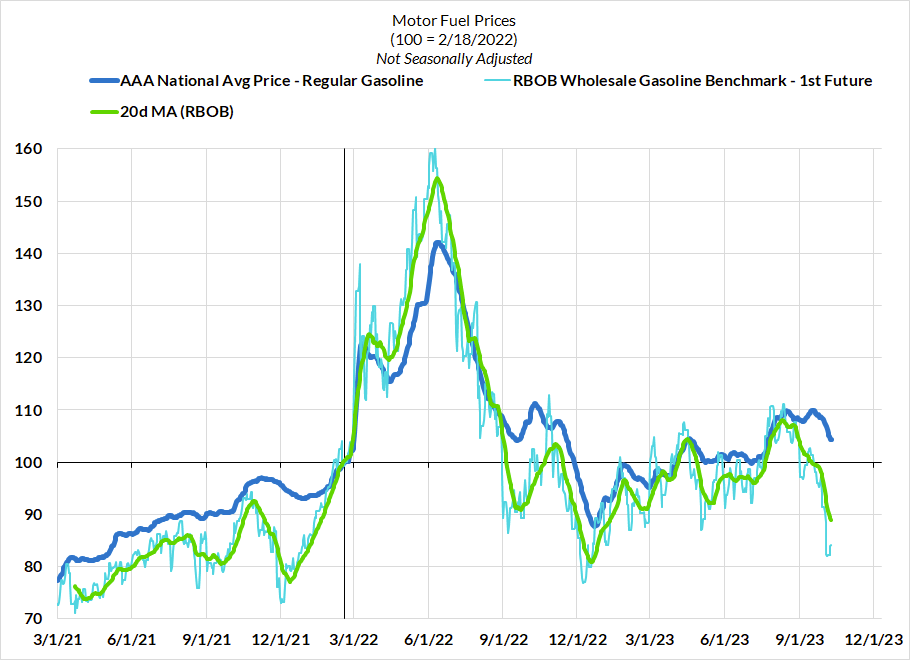
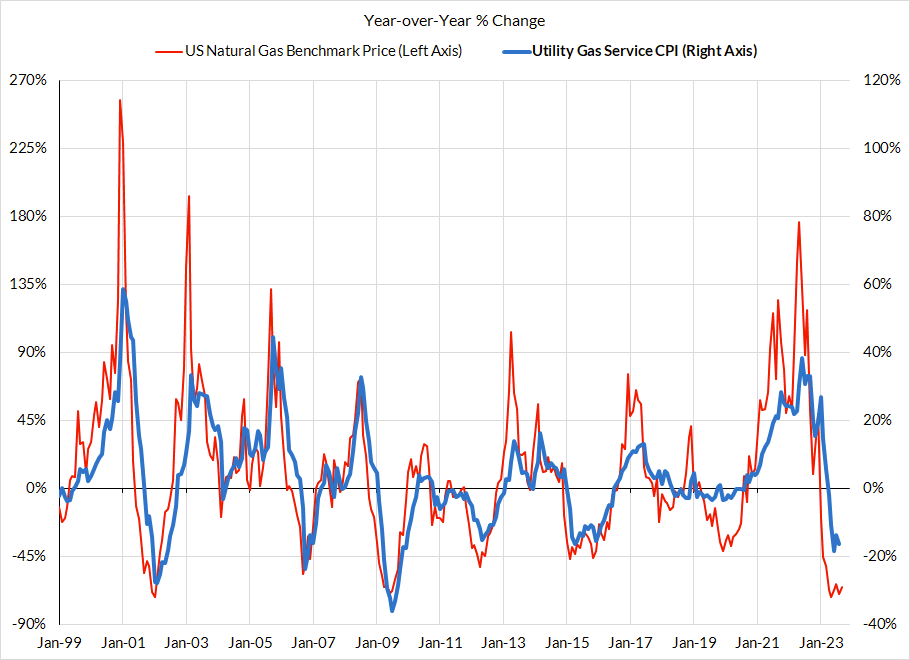
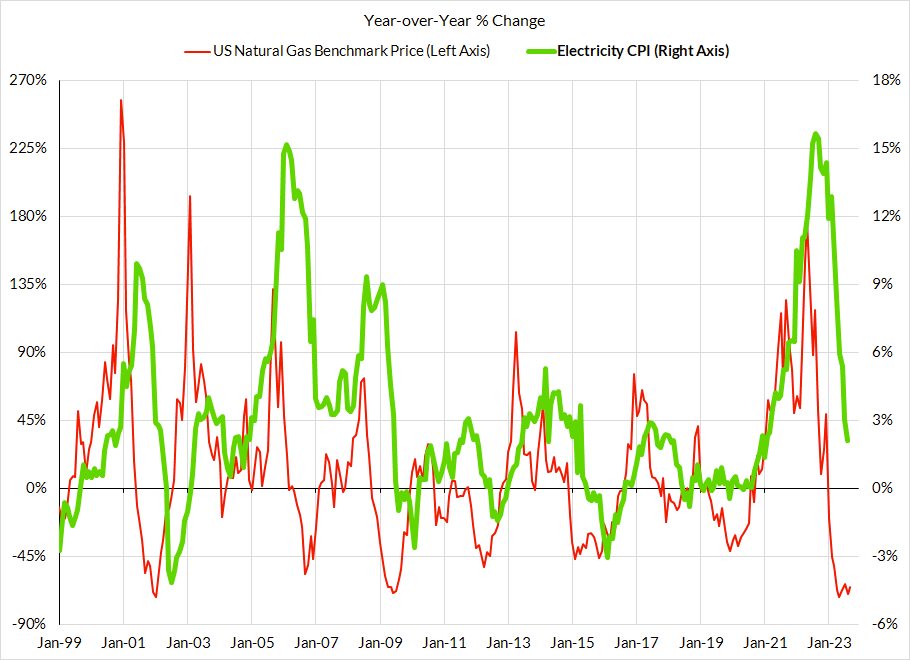
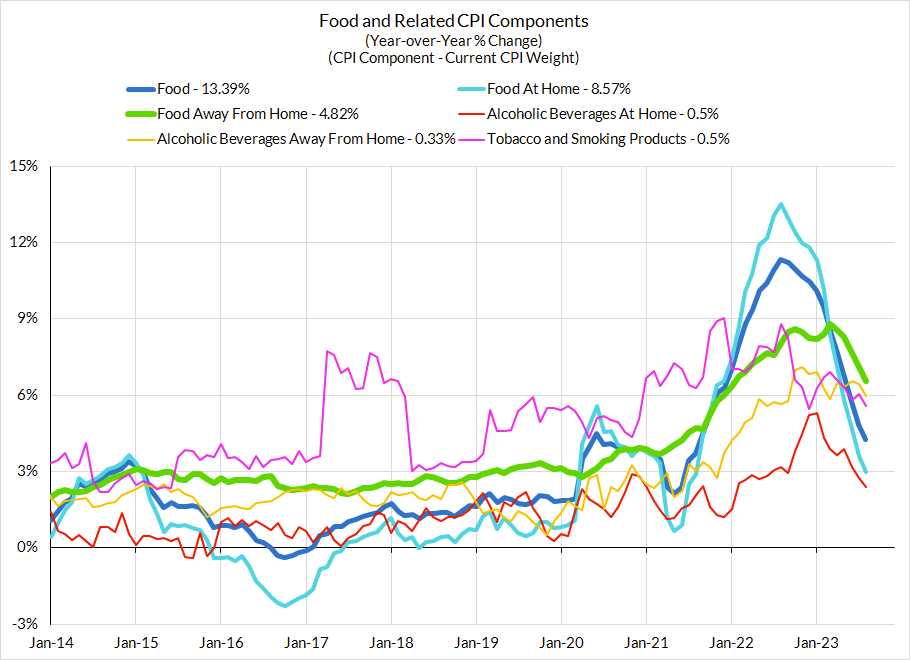
1. Headline CPI inflation has more downside risks than Core CPI over the next few months: While possibly less likely to reveal itself in September, we are likely to see consensus overestimate non-core inflation dynamics. Diesel prices have fallen off from their local peaks and should ultimately help facilitate food disinflation. Electricity prices have been falling with a long lag relative to natural gas prices. And gasoline prices are falling more noticeably than would be implied by crude oil prices due to falling crackspreads.
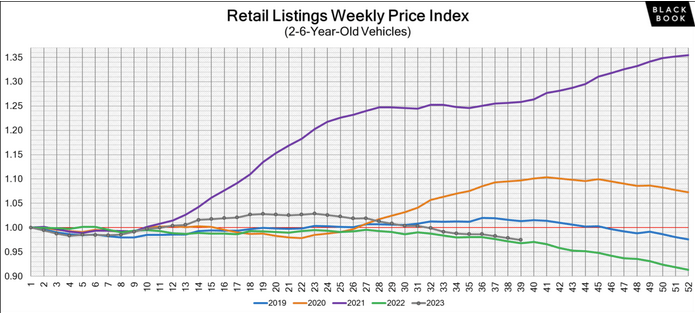
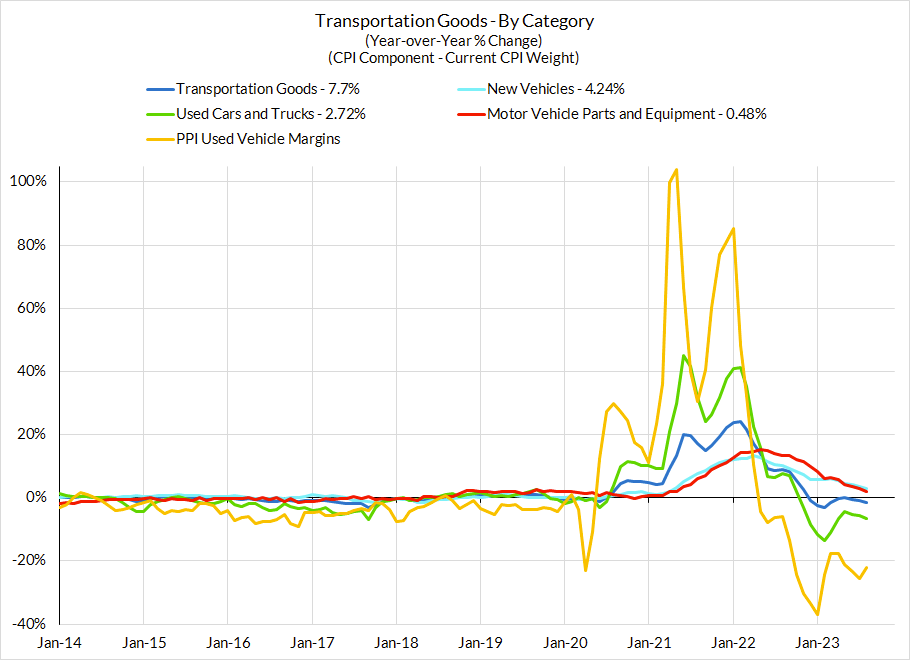
2. Used car deflation is ongoing but much of it will be masked by an aggressive seasonal factor: The not seasonally adjusted used car price data likely fell sizably in September, but the BLS factors in much of this deflation as merely the artifact of seasonal adjustment (~3.3% month-over-month deflation needed just for seasonal adjusted estimates to stay flat). This is likely not entirely a seasonal phenomenon, in which case there will be more deflationary payback in a few months' time. We would still be careful about extrapolating from private sector estimates of used car price inflation into CPI. There are lags and scaling issues.
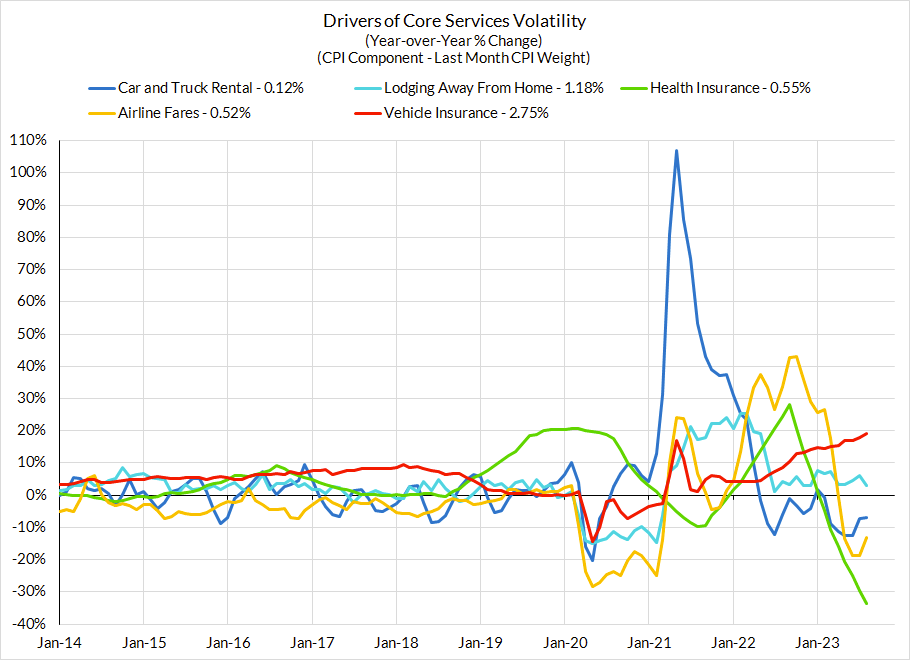
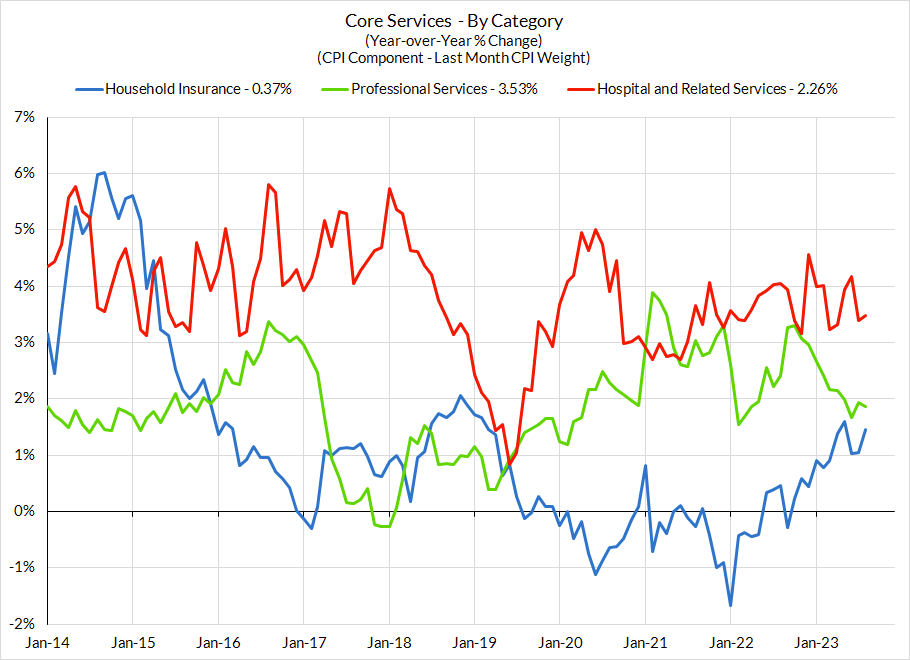
3. For reasons we continuously discuss (and include below), "Supercore" CPI will continue to show "reacceleration" even as "Supercore" PCE decelerates: Core services ex housing CPI is primed to reaccelerate thanks to additional reversion in airfares CPI, the hot readings on vehicle insurance CPI, and the methodological quirks that start to push up health insurance CPI starting with the October release (comes out November). Neither of these have any impact on PCE inflation, but the data will junk up the narrative about the true trajectory of Core and Supercore PCE. Ultimately, the Fed is going to stick to PCE as its gauge, even if CPI is the metric that drives news headlines and bigger market reactions.
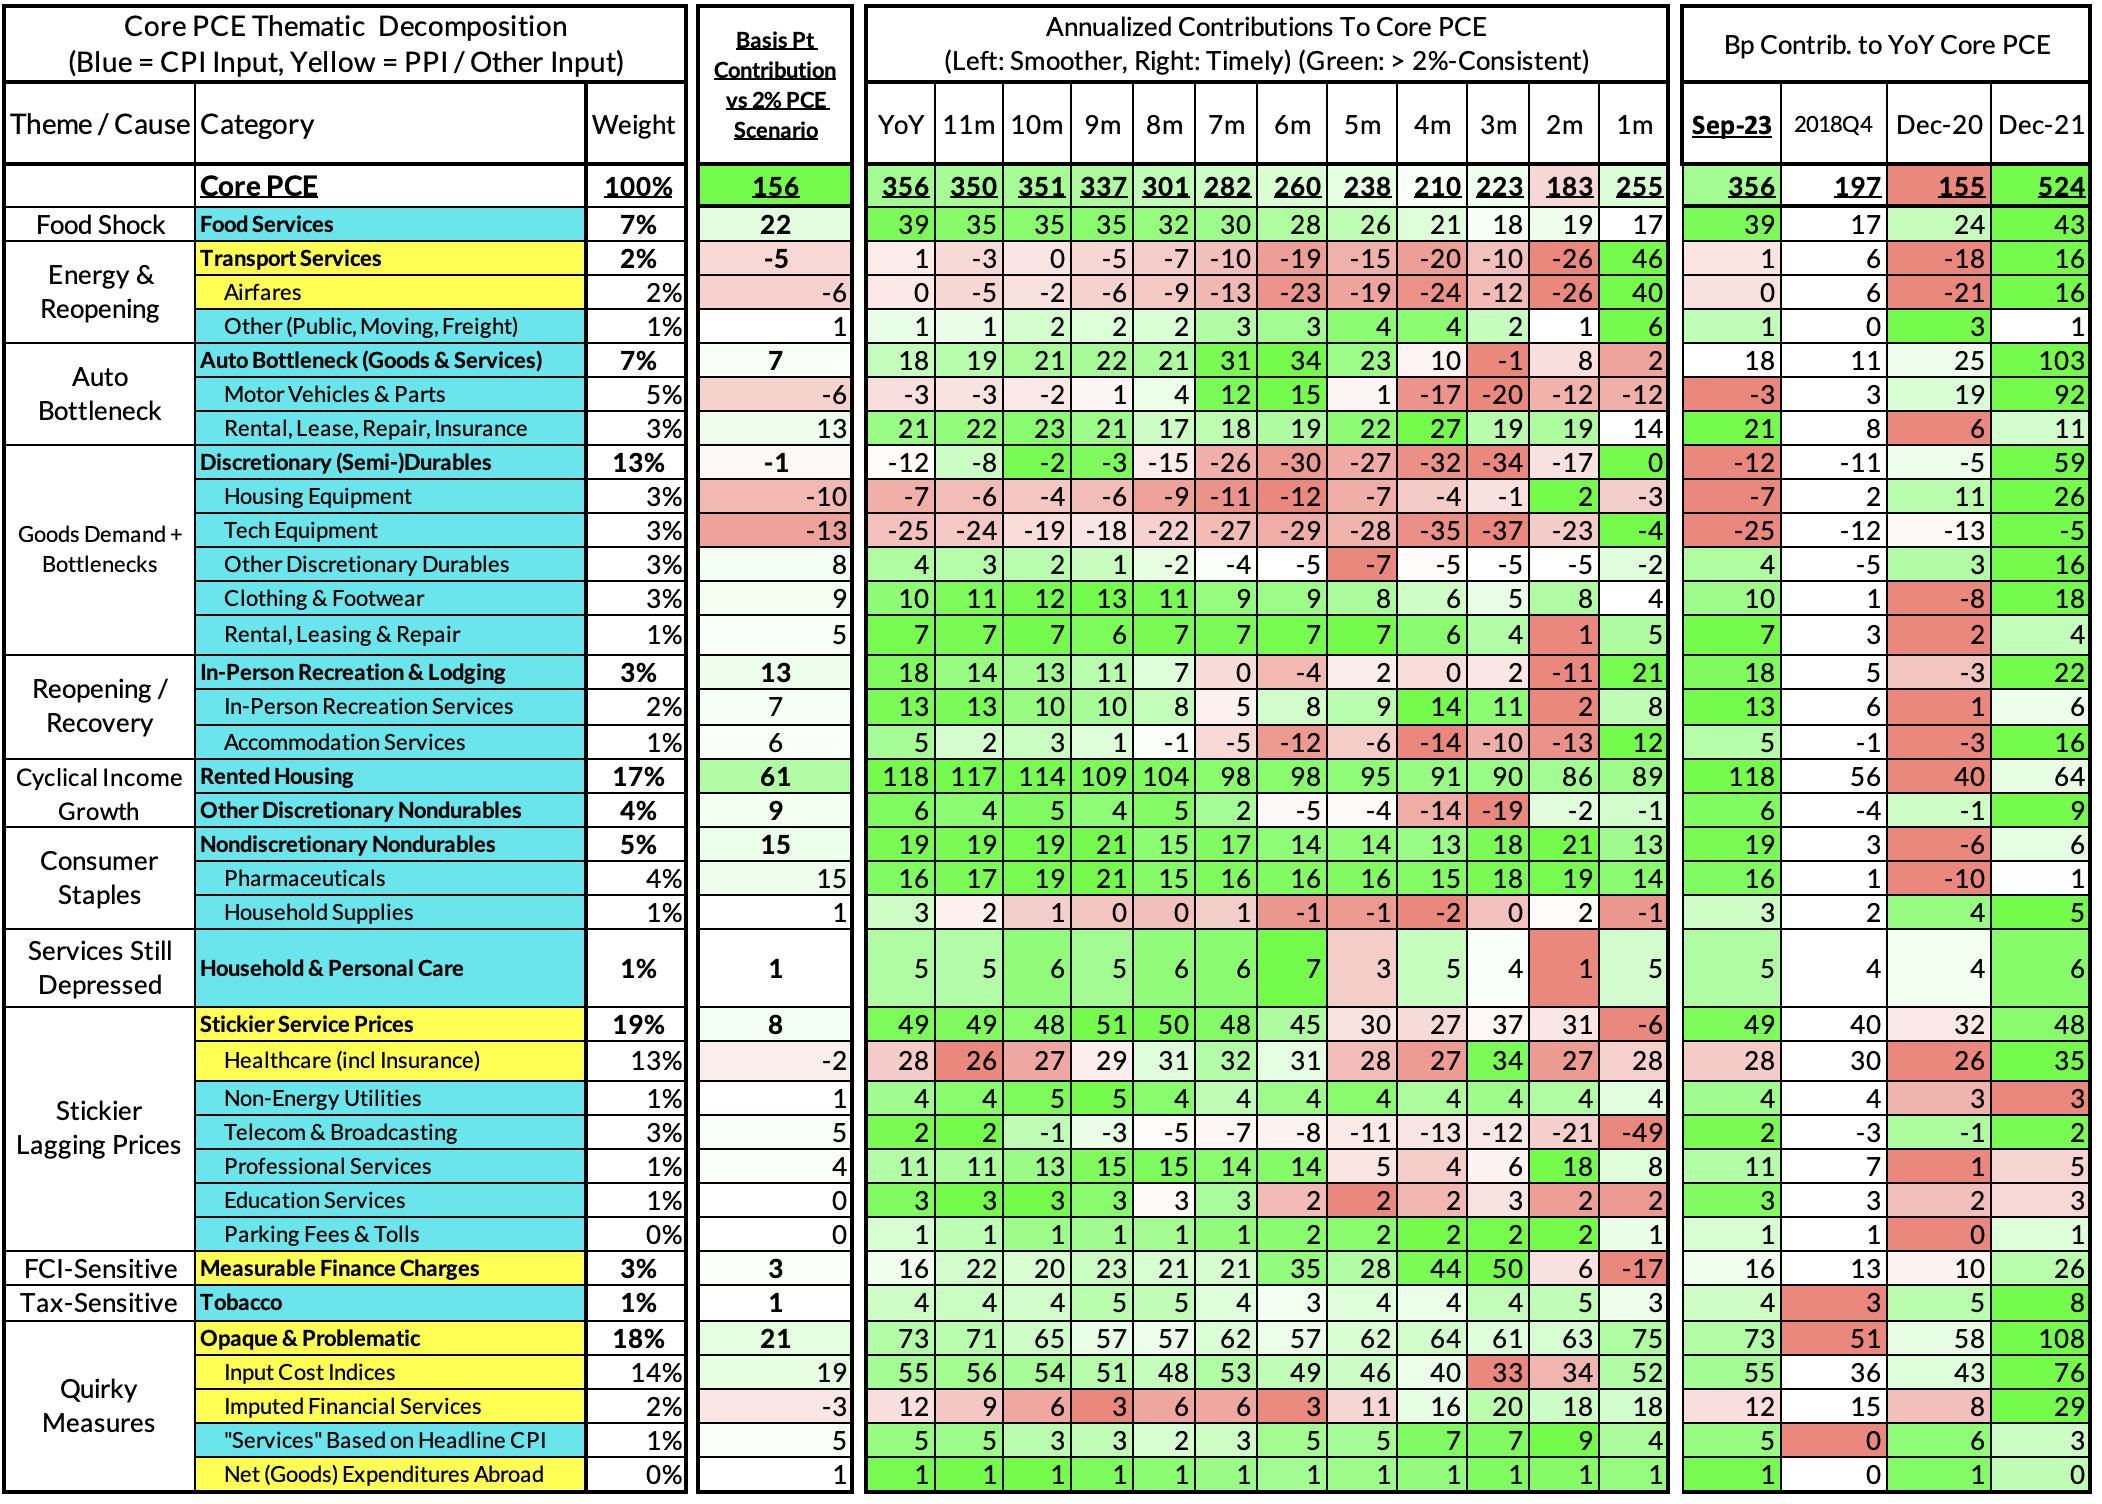
As we detailed in our previous inflation preview, there are multiple sources of divergence between Core/Supercore CPI & PCE, including (1) airfares, (2) healthcare services, (3) food services, (4) financial services, and (5) wage-based input cost indices. Given what we learned from today's PPI release across air transportation, healthcare services, and financial services, the likelihood of further progress in September PCE inflation has improved in at least 3 of the 5 relevant "wedge" segments.
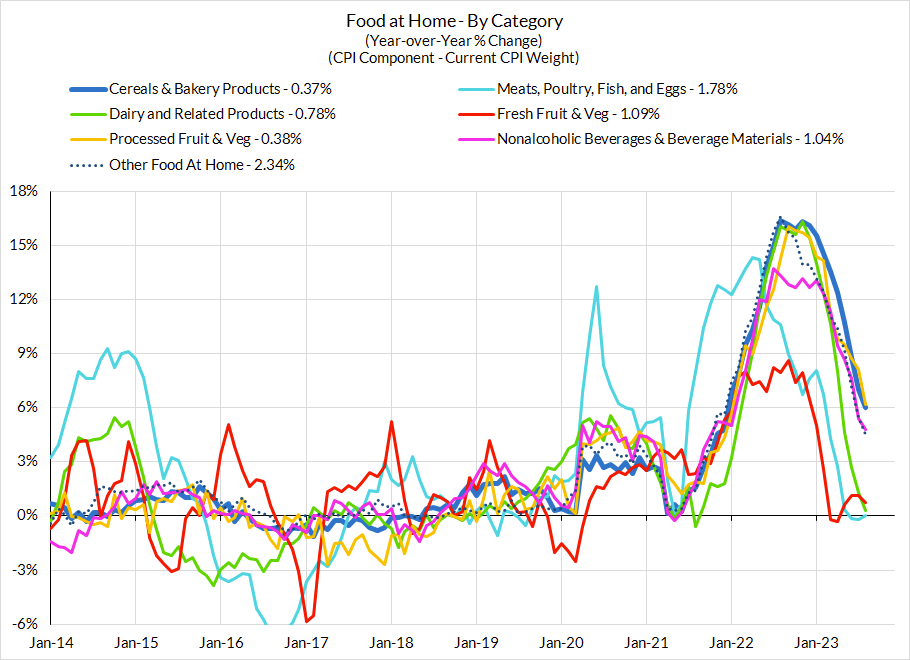
CPI Charts
Non-Core CPI Components
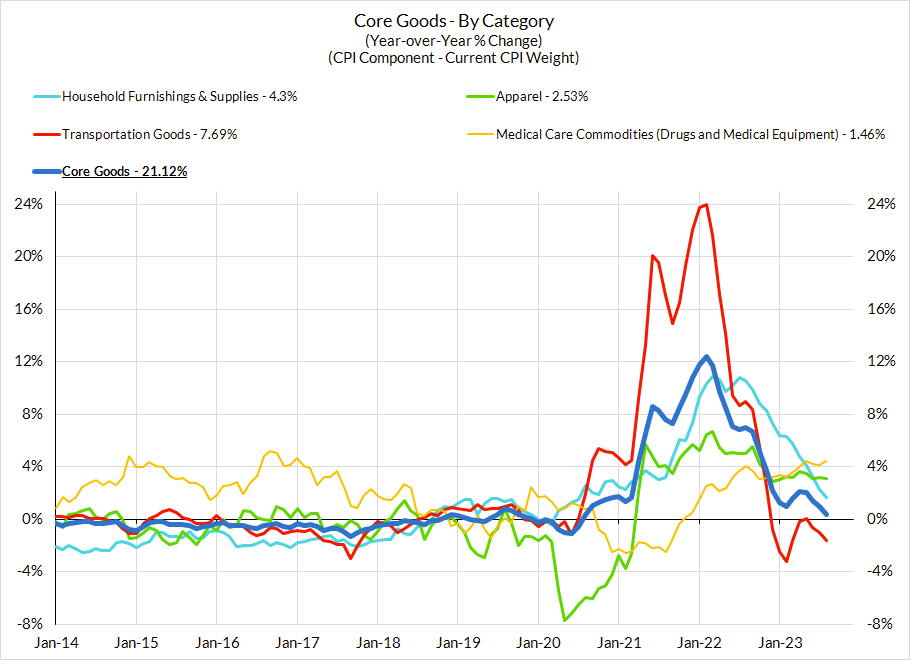
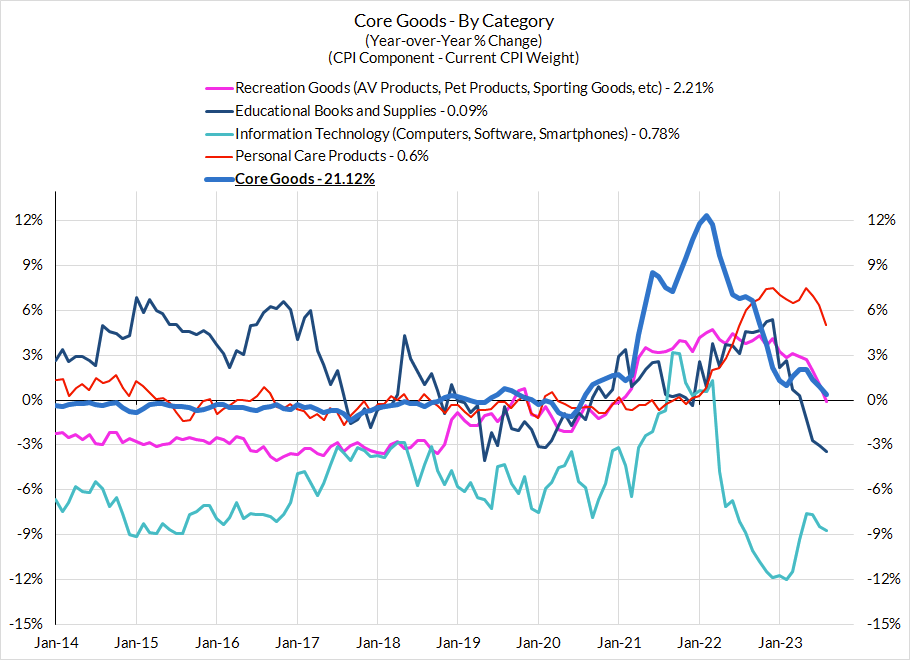
Core Goods CPI Components
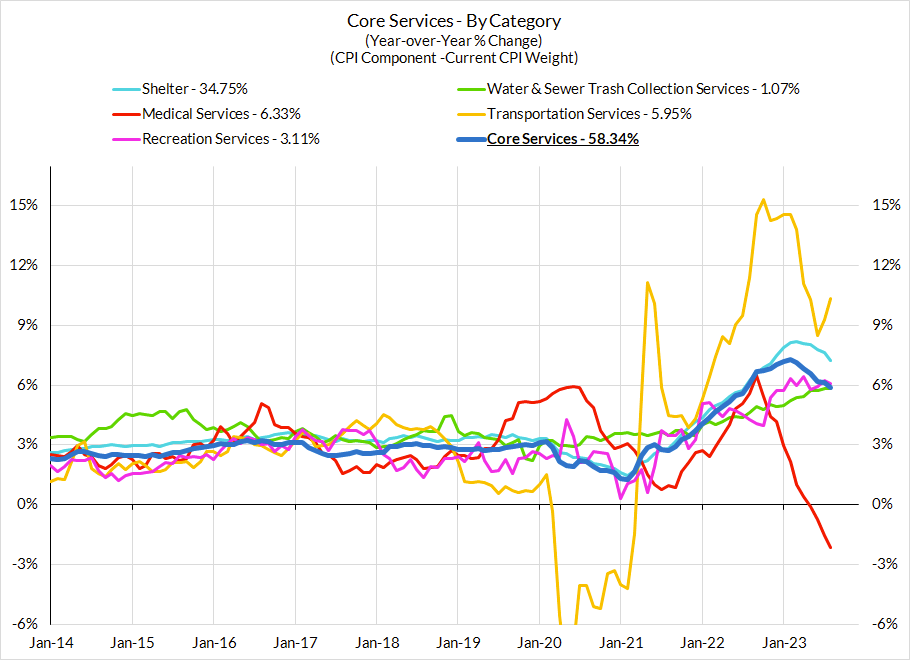
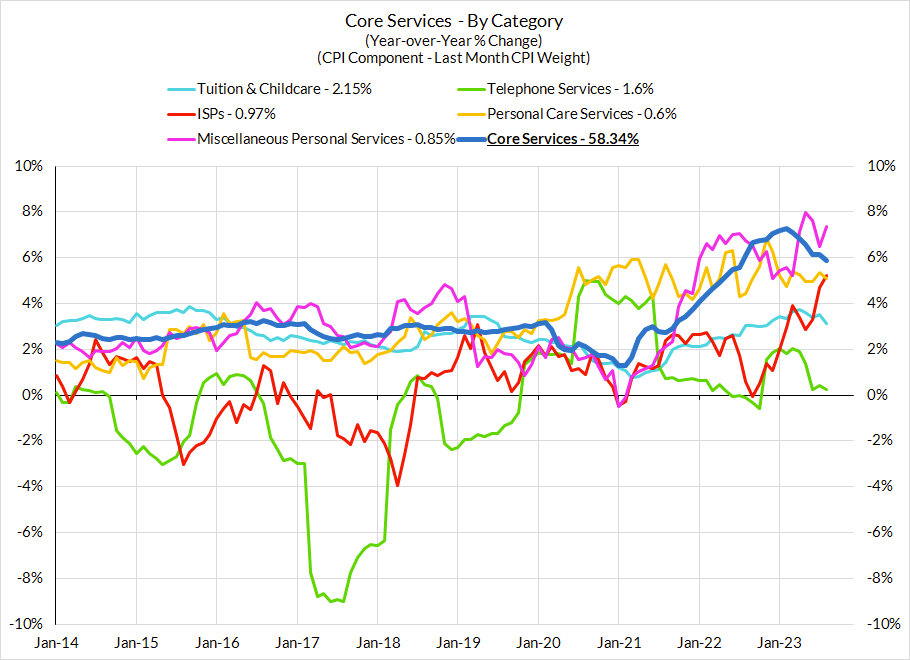
Core Services CPI Components (Not All Feed Into Core PCE)
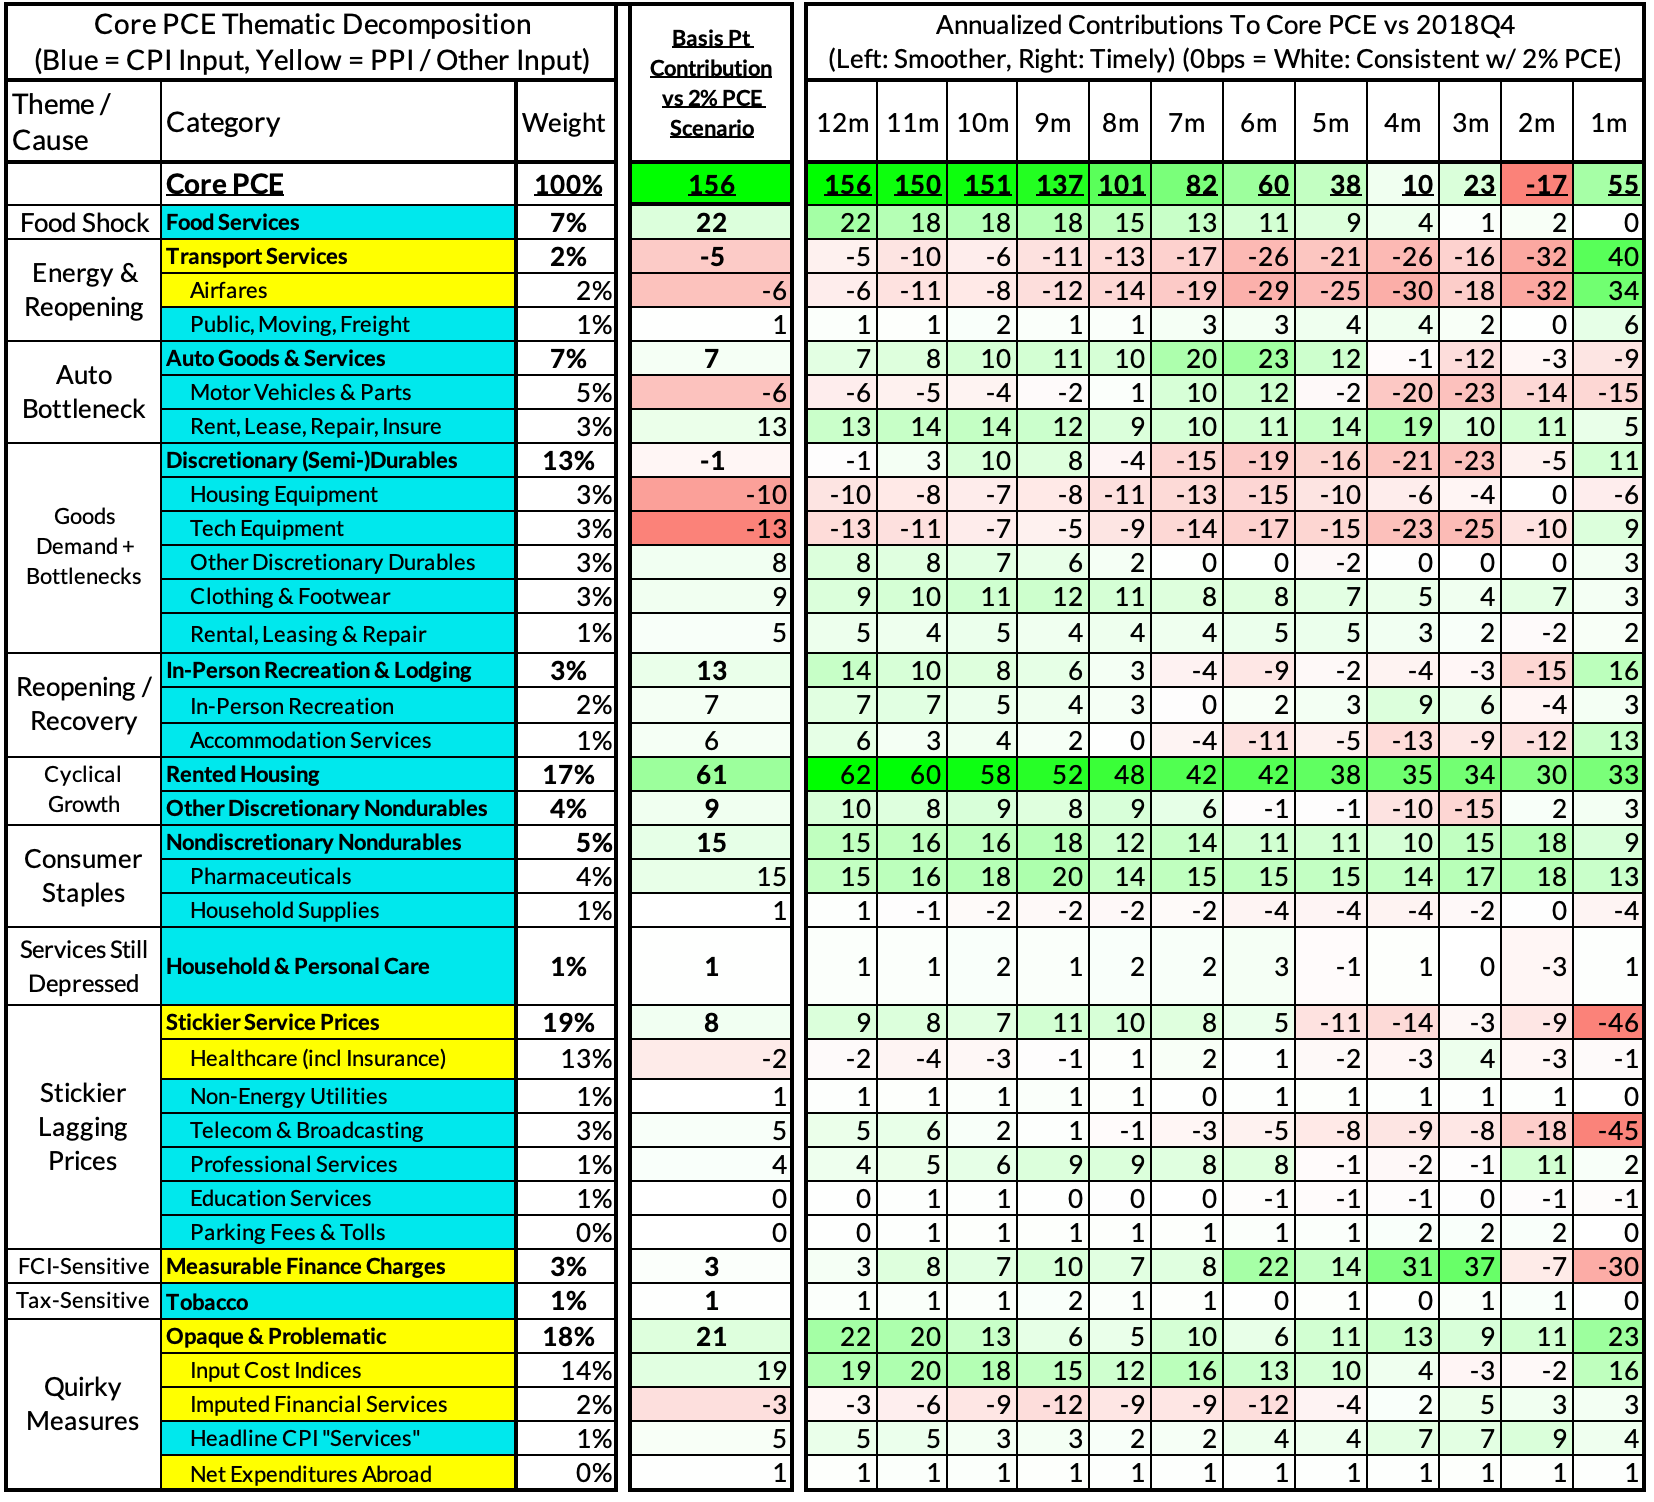
For the Detail-Oriented: Core PCE Heatmaps
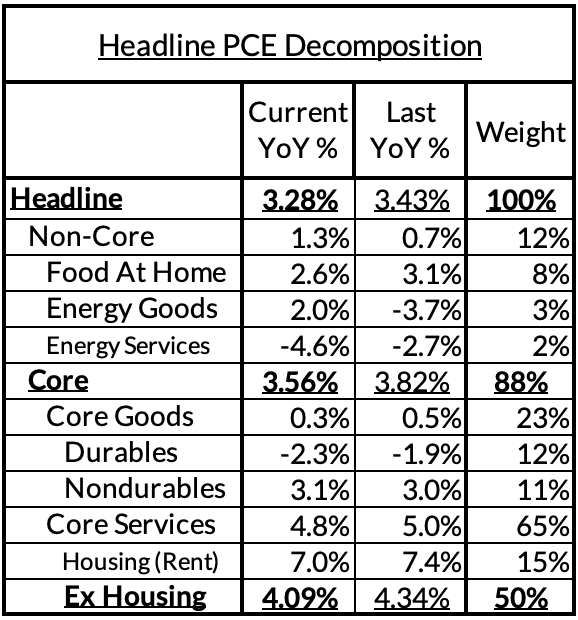
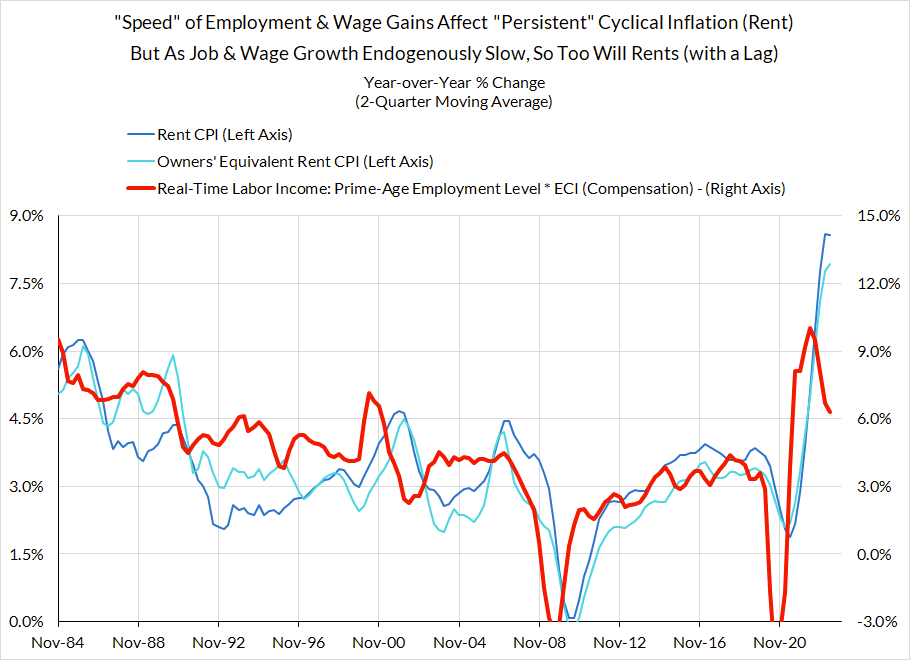
Right now Core PCE (PCE less food products and energy) is on track to run at a 3.56% year-over-year pace as of September, 156 basis points above the Fed's 2% inflation target for PCE. That overshoot is disproportionately driven by catch-up rent CPI inflation in response to the surge in household formation (a byproduct of rapidly recovering job growth) and market rents in 2021-22. Rent is contributing 61 basis points to the 156 basis point core PCE overshoot.
There are other contributors to the overshoot:
- Some more supply-driven (automobile bottlenecks are likely to explain 7 basis points, while food inputs likely added 22 basis points to the overshoot)
- Some more demand-driven (in-person recreation and travel services likely added 13 basis points to the overshoot)
- So with demand- and supply-side drivers (consumer staples and discretionary goods likely added 23 basis points).
- Some oddball segments have offsetting effects (measured financial service charges now likely adding 3 basis points, while contributions from input cost indices and imputed financial services likely added 16 basis points to Core PCE vs 2%-consistent outcomes).
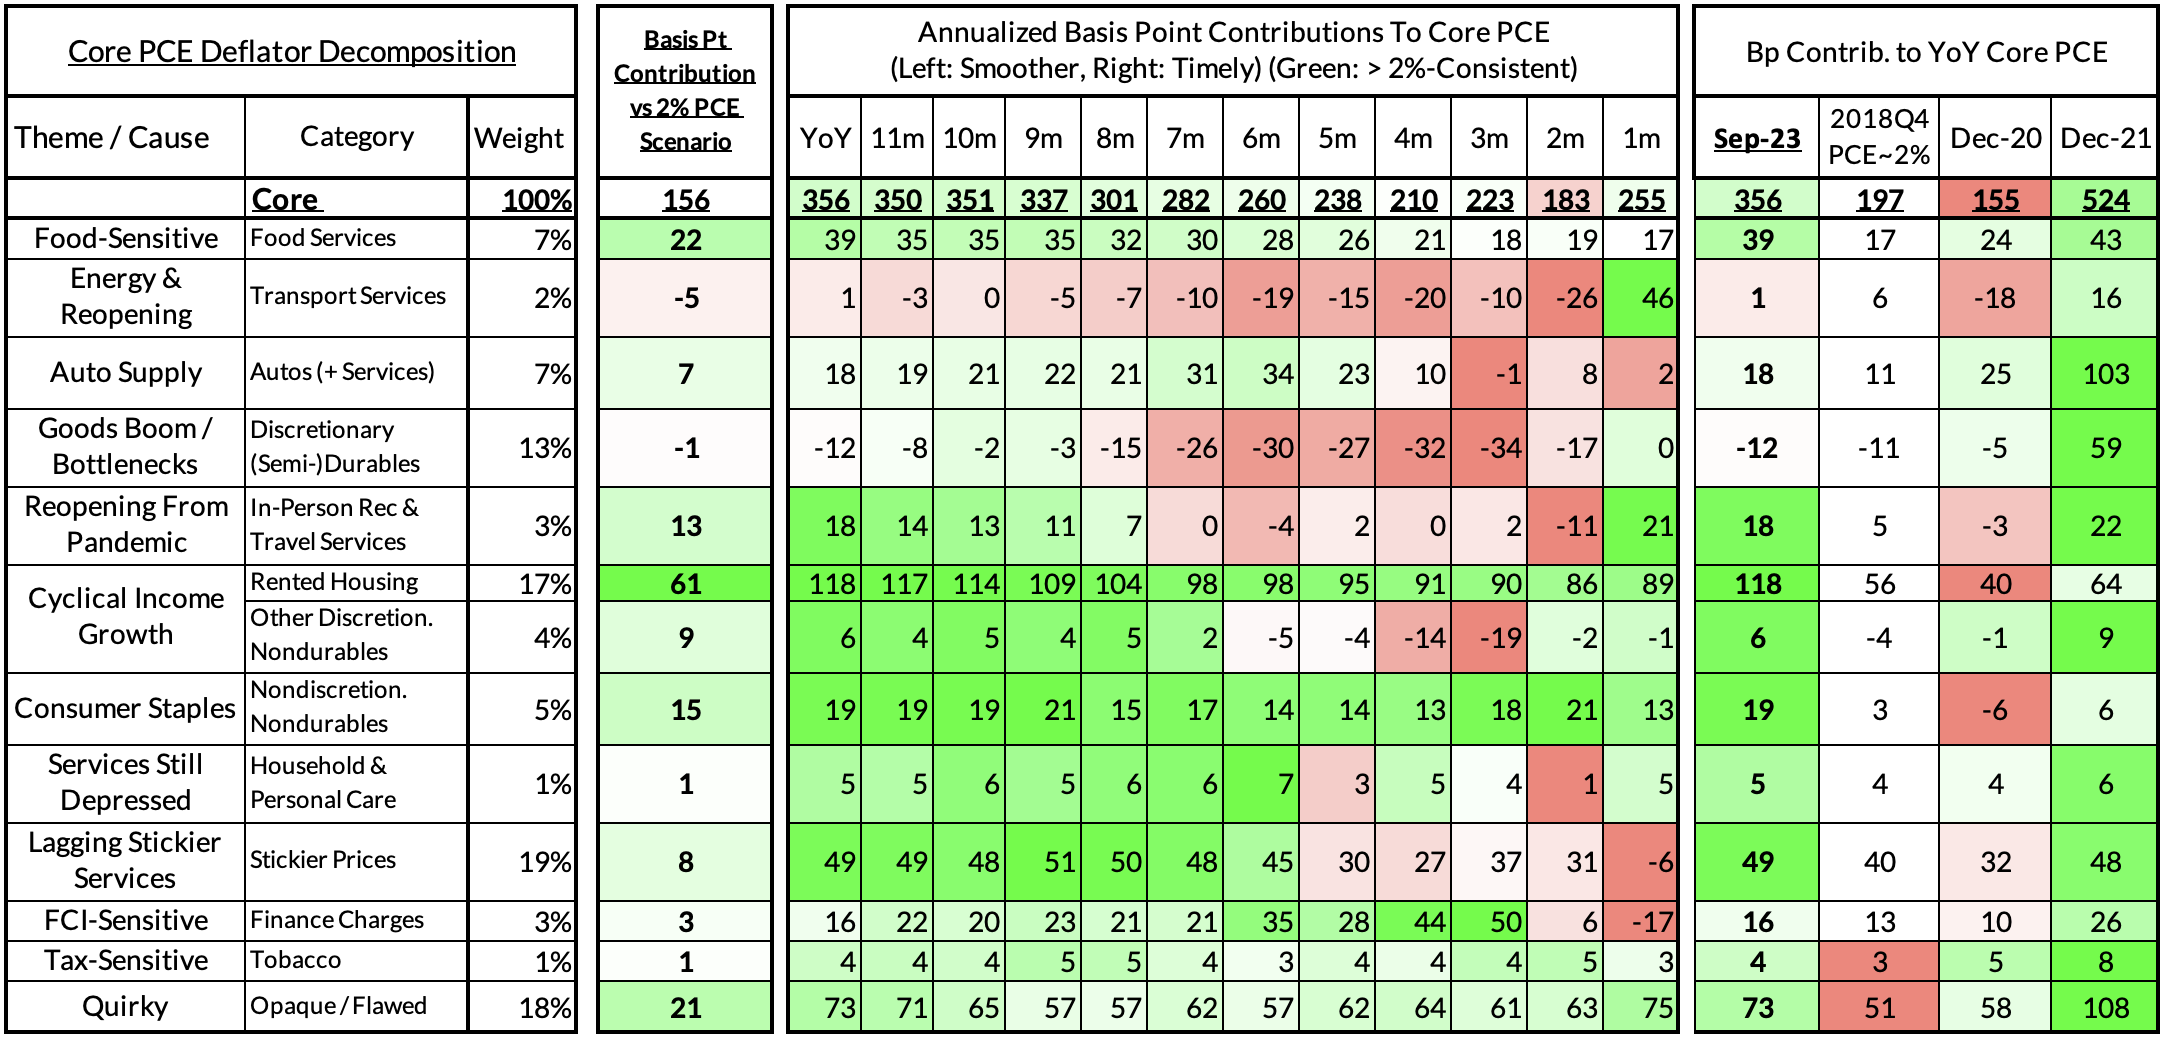
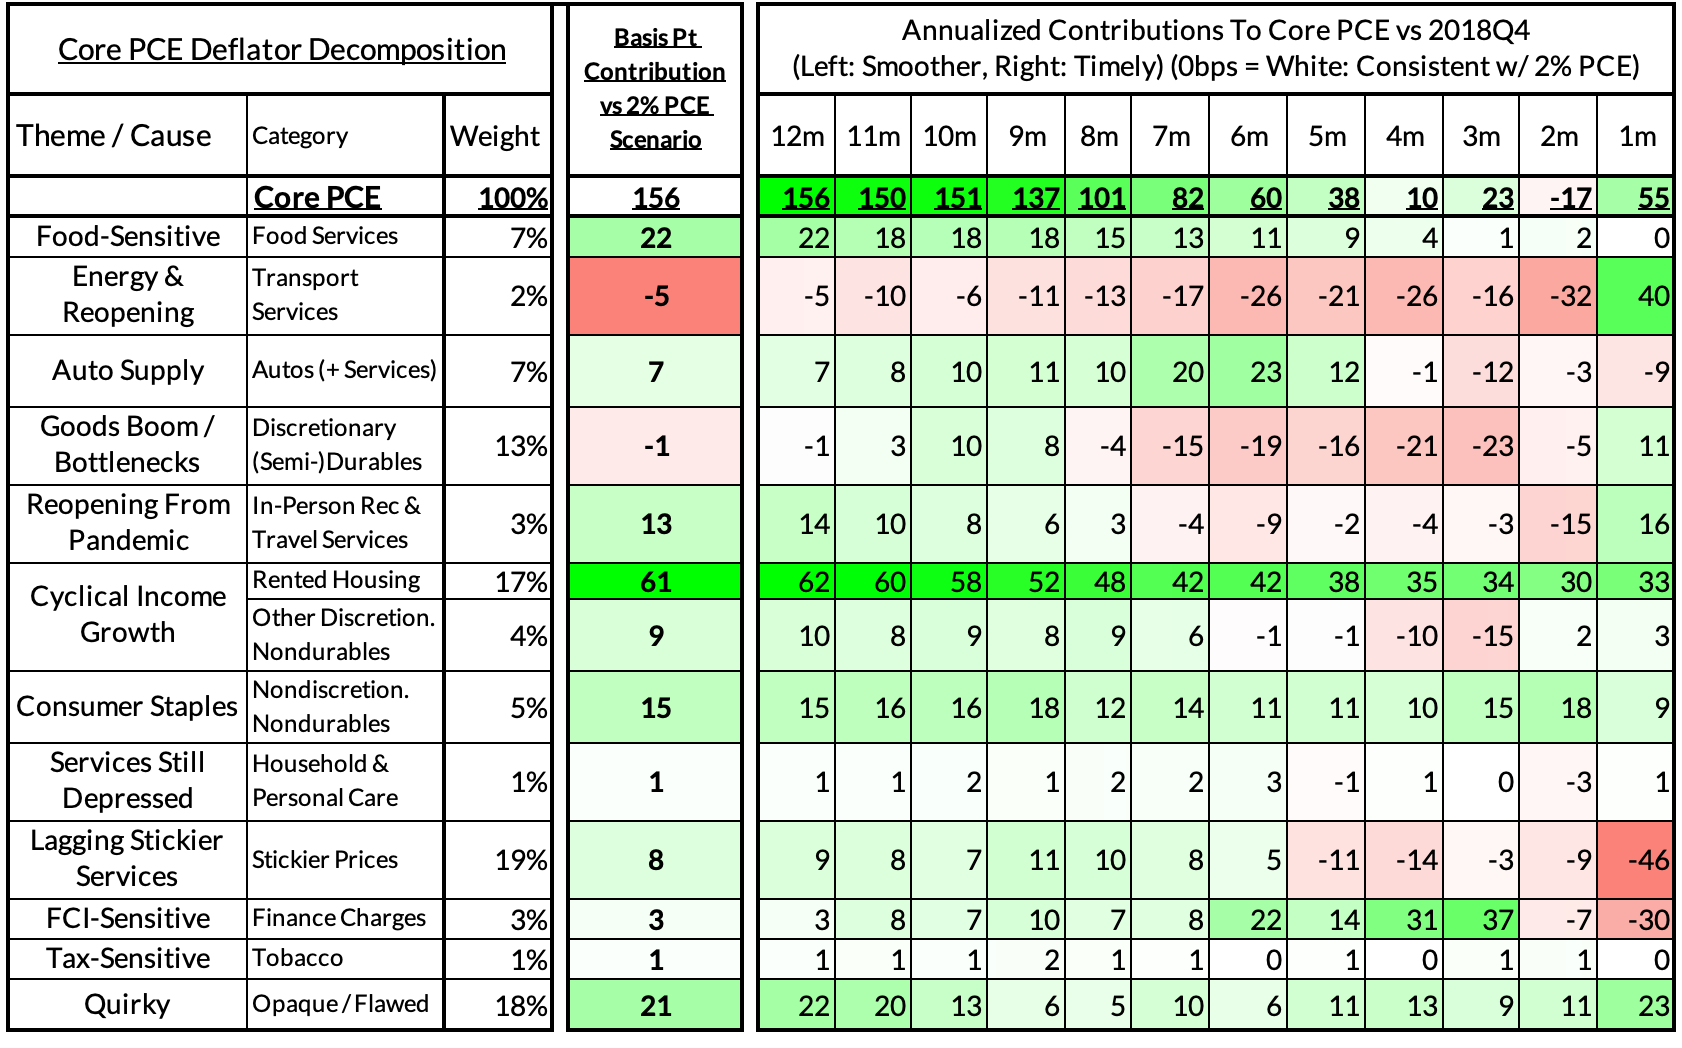
The final two heat maps below gives you a sense of the overshoot on shorter annualized run-rates. September monthly annualized core PCE is likely to yield a 55 basis point overshoot vs 2% target inflation (2.55% annualized), but we would flag that these estimates are subject to numerous sources of revision over the upcoming days and weeks.
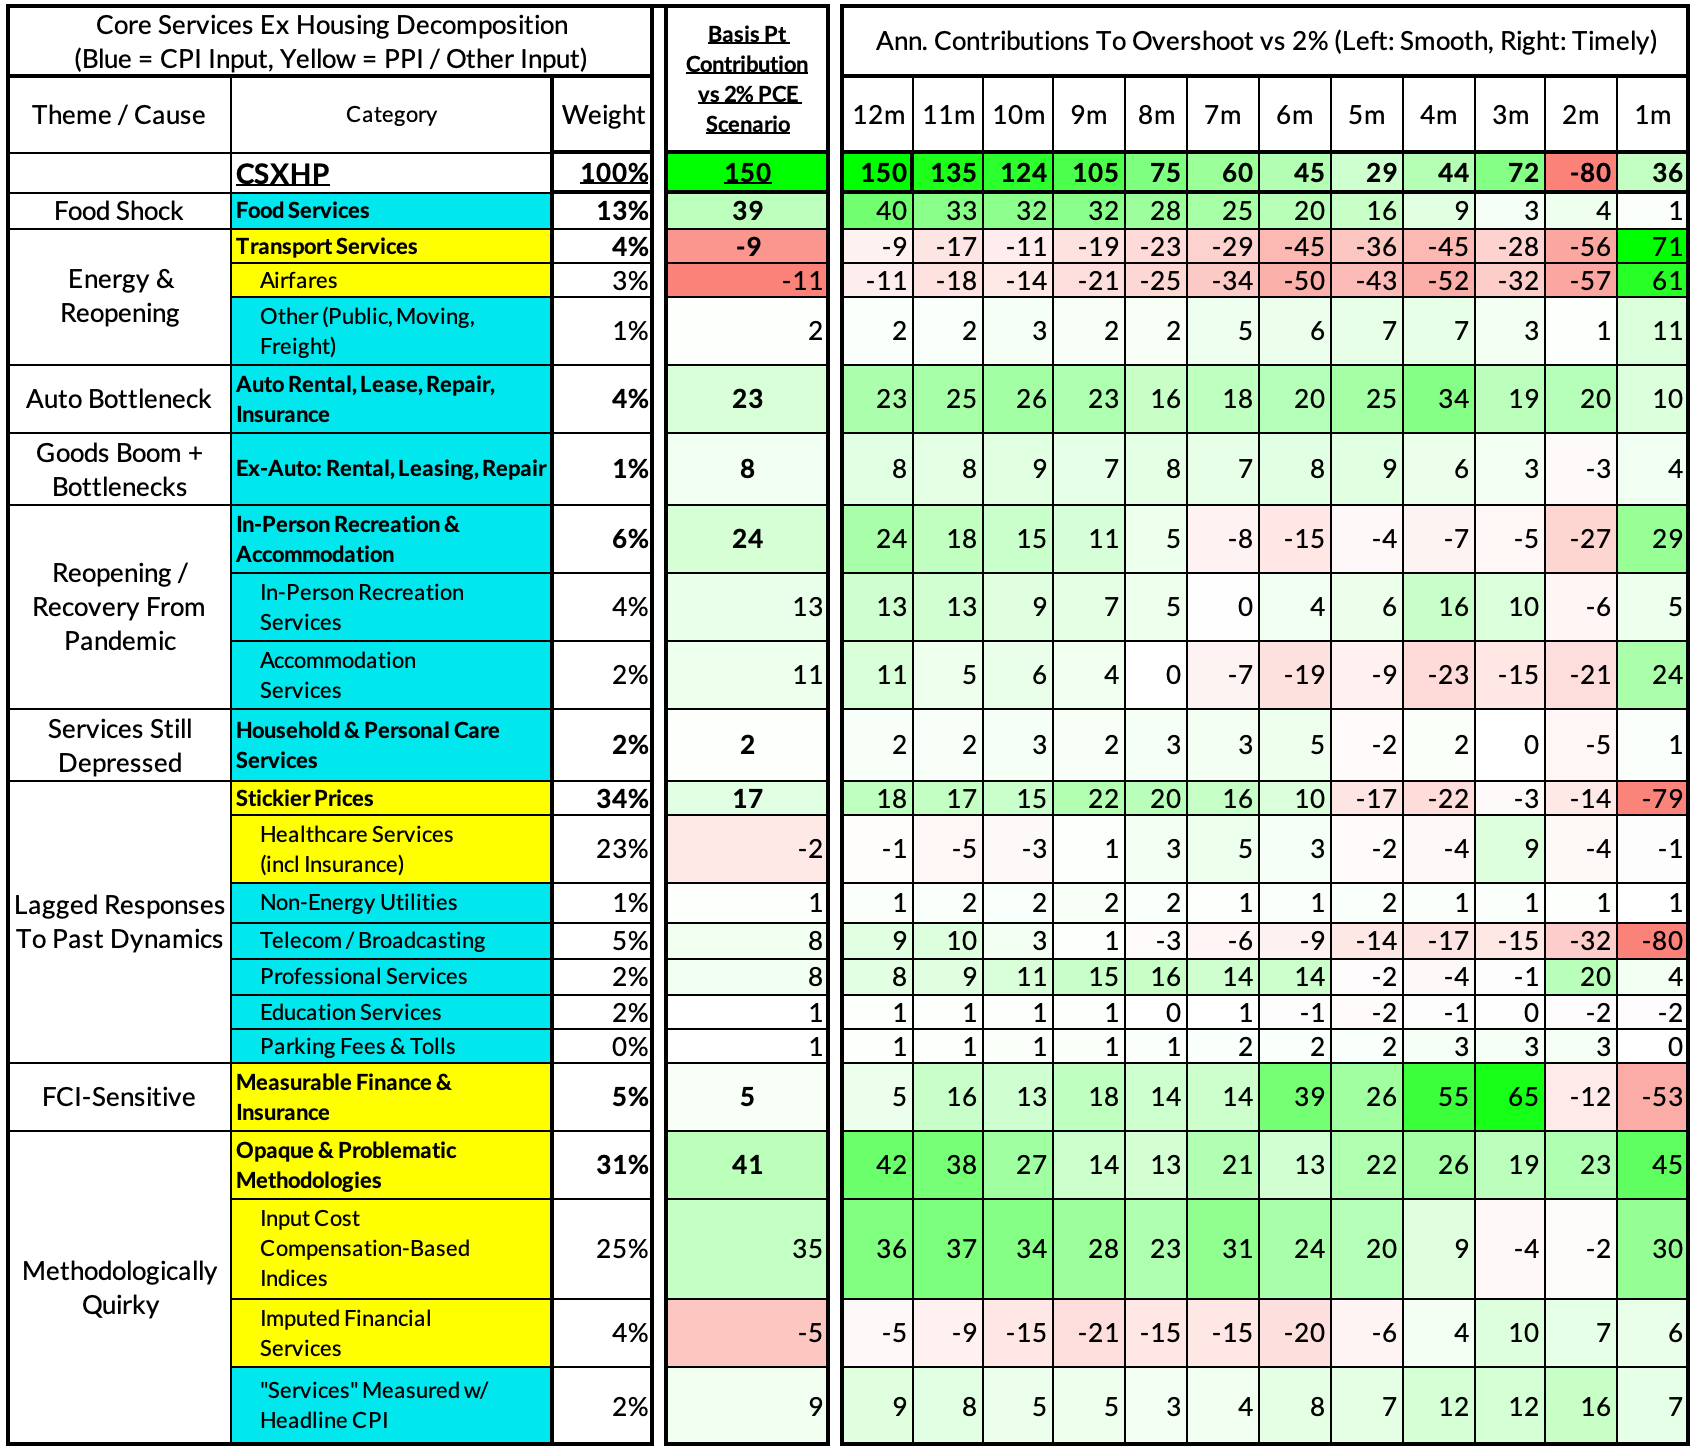
For the Detail-Oriented: Core Services Ex Housing PCE Heatmaps
The September growth rate in "Core Services Ex Housing" ('supercore') PCE is on track to run at 4.09% year-over-year, a 150 basis point overshoot versus the 2.68% run rate that coincided with ~2% headline and core PCE.
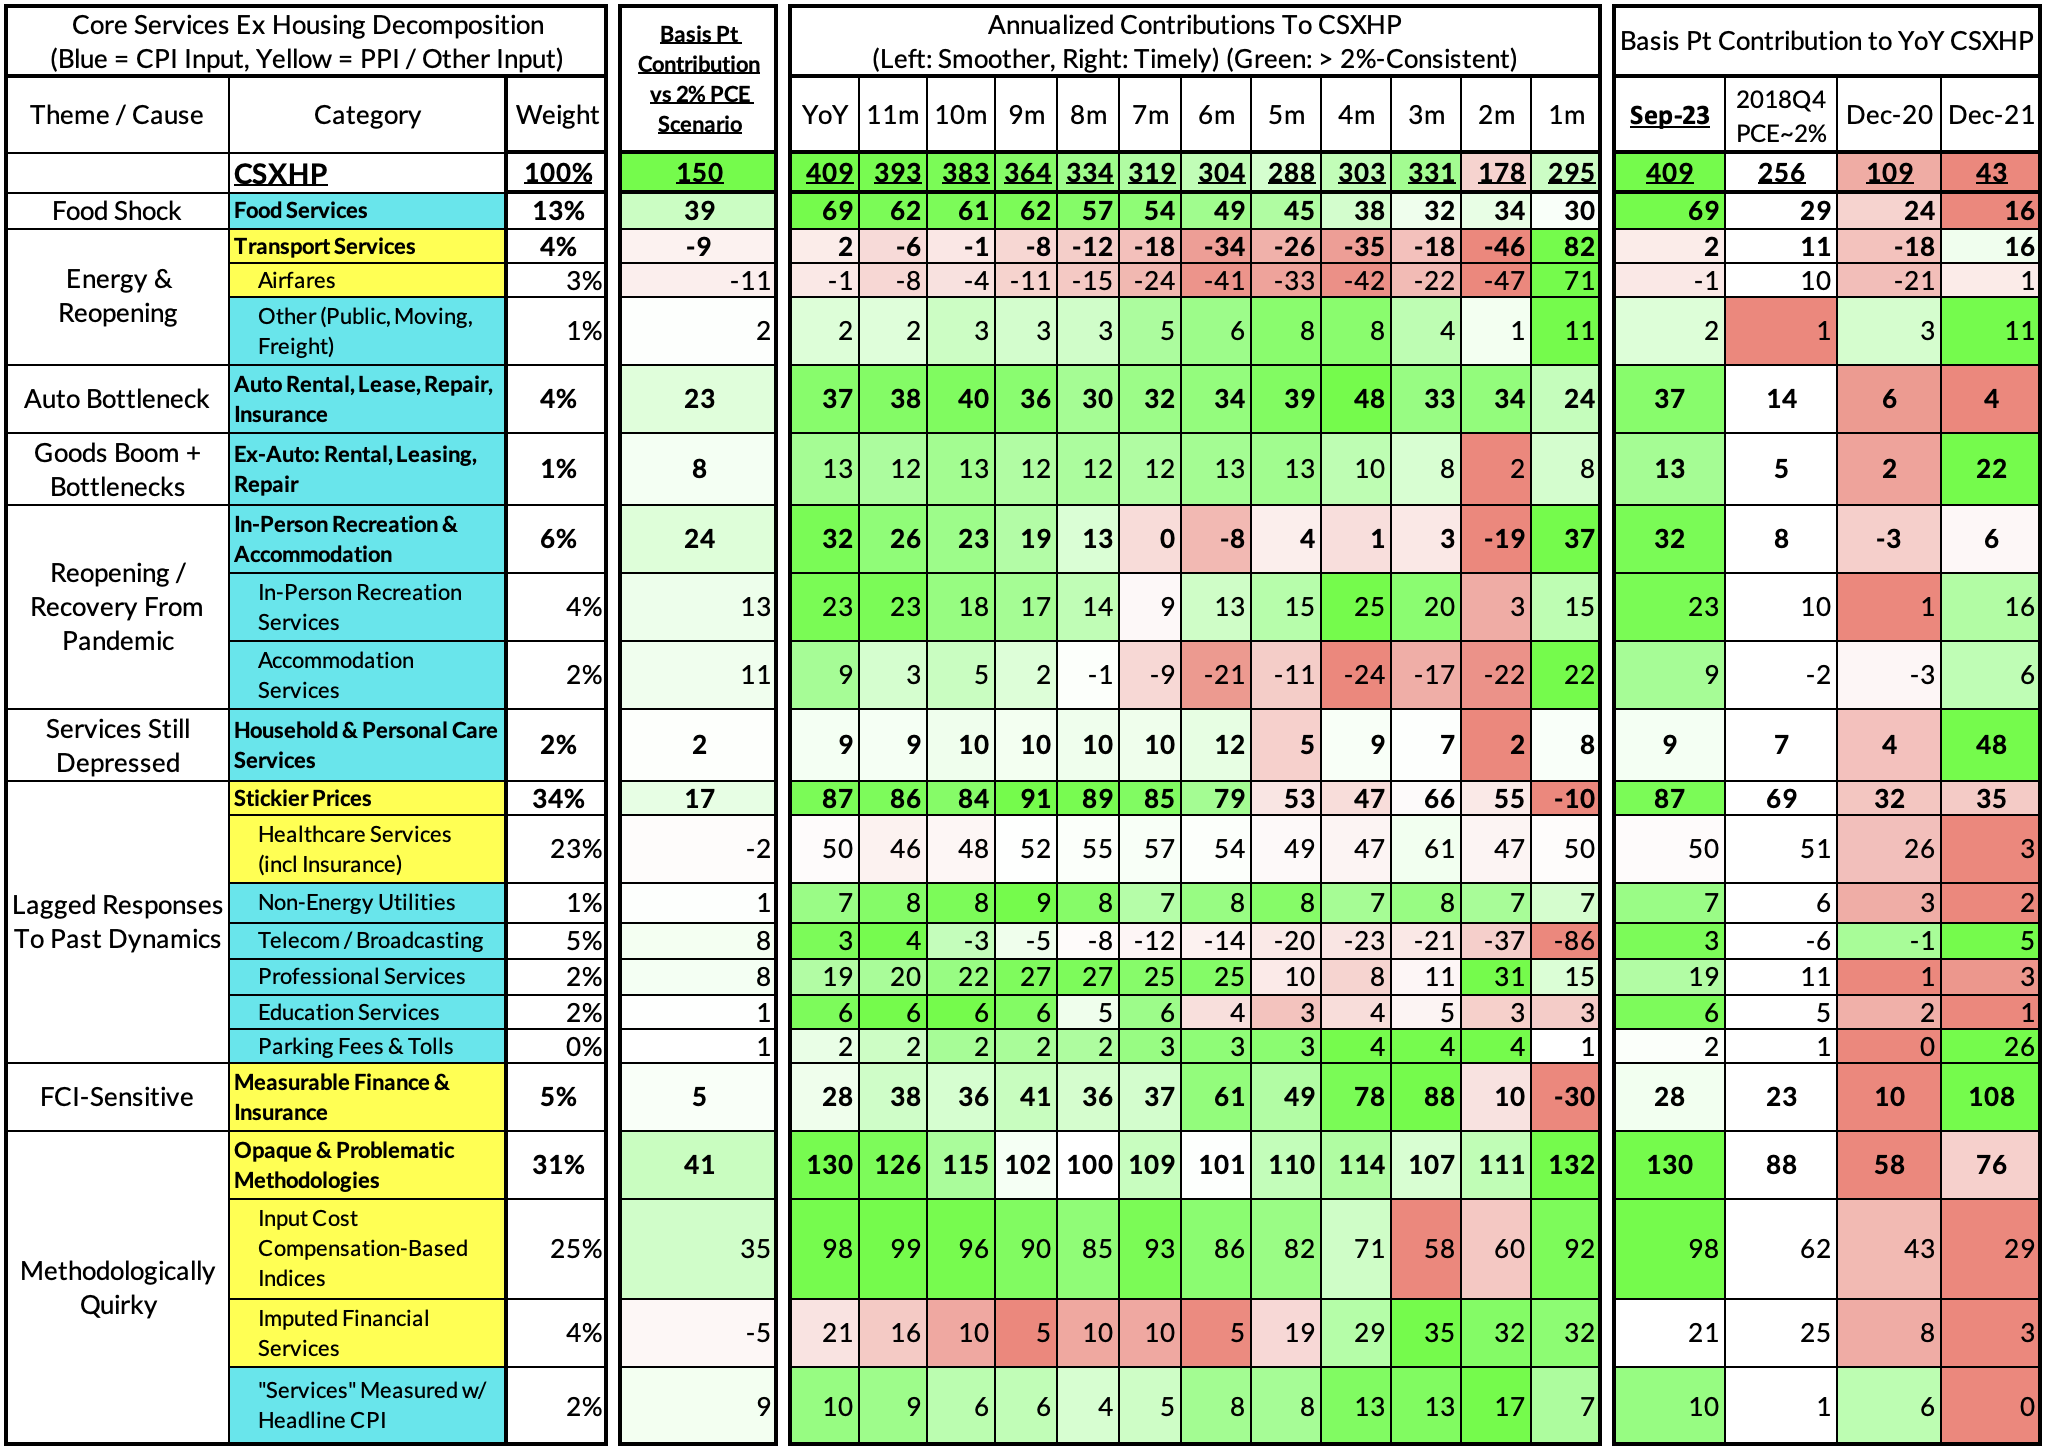
September monthly supercore is on track to run at a 2.95% annualized rate, a 36 basis point overshoot of what would be consistent with 2% headline and core PCE.
Past Inflation Previews & Commentary
- 2/12/21: The Good, The Bad, and The Transitory
- 10/27/21: Offsetting Persistent Inflationary Pressures With Disinflationary Healthcare Policy
- 11/8/21: Q4 CPI Preview: What Will Hot Q4 Inflation Tell Us About 2022 Dynamics?
- 12/9/21: November CPI Preview: Planes, Constraints, and Automobiles: What to Look For in a Hot November CPI Print
- 2/9/22: January CPI Preview: Calendar Year Price Revisions Skew Risks To The Upside in January, But The Balance of Risks May Shift Soon After
- 3/9/22: Feb CPI - Short Preview: Inflection Points - Headline Upside (Putin), Core Downside (Used Cars)
- 4/11/22: March CPI Preview: Managing The Endogenous Slowdown: Transitioning From A Rapid Recovery To Non-Inflationary Growth
- 5/10/22: April CPI Preview: Subtle Headline CPI Upside, But Core PCE Should Reveal More Disinflation
- 6/9/22: May Inflation Preview: Peak Inflation? Not So Fast, My Friend. Upside Surprises Loom Large
- 7/12/22: June Inflation Preview: Lagging Consensus Catches Up To Hot Headline, But Relief Nearing…
- 8/8/22: July Inflation Preview: Finally, Fewer Fireworks
- 9/9/22: August Inflation Preview: Can Used Cars & Gasoline Overcome The Rest of The Russia Shock?
- 10/12/22: September Inflation Preview: Timing The Goods Deflation Lag Amidst Hot Inflation Prints
- 11/12/22: October Inflation Preview: When Will We See The 'Real' Goods Deflation Materialize? Until Then, Rent Rules Everything Around Me
- 12/12/22: November Inflation Preview: The Goods Deflation Cavalry Is Coming, But OER Can Upset An Optimistic Consensus Tomorrow
- 1/11/23: December Inflation Preview: Risks Skew To The Downside, But Upside Scenarios Remain Plausible
- 2/12/23: January Inflation Preview: Residual Seasonality & Stickier Services Pose Upside Risks
- 3/9/23: February Inflation Preview: Q1 Upside Risks Remain. Goods and Reopening-Sensitive Sectors Matter More Than Wages
- 4/8/23: March Inflation Preview: The Fed Seems Unaware We're Entering Another Automobile Inflation Storm
- 5/7/23: April Inflation Preview: Can PCE Silver Linings Overcome CPI Bite from the Used Cars Wolf and a "Slow Slowdown" in Rent CPI?
- 6/9/23: May Inflation Preview: Last Month of Used Cars Driving Upside Risk?
- 7/9/23: June Inflation Preview: The Path To The Fed's 2% PCE Goals Is Getting Clearer But Not Soon Enough To Forestall a July Hike
- 8/8/23: July Inflation Preview: Used Car Downside Can Hasten Path To 2% Core PCE Outcomes
- 9/12/23: August Inflation Preview: CPI Risks Growing More Balanced Even As PCE Risks Tilt More To The Downside