Our inflation previews are typically released to the public with a delay relative to what we provide to our exclusive High Frequency Descriptive Analysis (HFDA) distribution subscribers. The release of the revised seasonal factors led to the idiosyncratic delay in making this particular preview public, but at least for the sake of preregistering our views, we would rather this preview be made public at a late hour than not be made public at all. Please reach out to us here if you would like to access the full preview when it is first made available.
Core-Cast is our nowcasting model to track the Fed's preferred inflation gauges before and through their release date. The heatmaps below give a comprehensive view of how inflation components and themes are performing relative to what transpires when inflation is running at 2%.
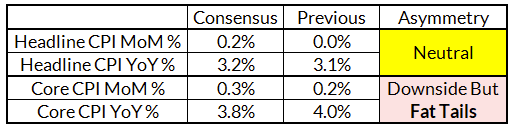
Our biggest warning heading to the January batch of inflation data is that the tails are fat. To be precise, the odds of a large upside and downside surprise are elevated relative to most other months. While the revised seasonal factors suggest mild downside skew relative to the consensus forecast, the plausibility of tail risk outcomes on Tuesday are high on both sides of the distribution. Our bottoms-up forecast for core CPI is 0.24% month-over-month gain, relative to a consensus forecast of 0.3%.
The implications of this data release are also high. The Fedspeak of late has sounded a hawkish tone, keen to go against more dovish market pricing and rein in the excitement about interest rate cuts. The Fed instinctively wants to let the inflation data drag them to cuts (rather than get ahead of where the data is and risk getting caught offsides). Heading into the storm of Q1 inflation data, there is scope for major upside and downside surprises. Our base case is for the Fed to begin cutting in May. Nevertheless, there remain legitimate scenarios in which the Fed cuts in March or June.
Forecast Details
Why are the tails fat? Differing theories for residual seasonality. The heat in the last two January CPI releases (2022, 2023) could be explained in two ways. The first was that post-pandemic seasonal patterns had shifted to load more price increases into the beginning of the new calendar year. If so, the seasonal factors could still be playing "catch up" and cause seasonally adjusted estimates of inflation to continue looking hot in January and February. An equally plausible alternative theory is that those hot inflation prints were closer to a "lagged cost push" effect as firms played catch up on final pricing relative to cost pressures brewing in the previous 9-10 months (also explains why the residual seasonal strength was concentrated in goods pricing). If so, the absence of major cost push pressures in the last 9-10 months should support much cooler inflation outcomes. We are taking a weighted average of the two theories in our bottoms-up forecast.
Goods prices have high scope for volatility in the next two months. We have included the NSA and revised SA inflation readings for the components in our detailed forecast table because they reveal the elevated scope for volatility. Apparel is perhaps the most noteworthy component in January to show high scope for volatility. If we see a greater reversion to pre-pandemic pricing patterns, seasonally adjusted Apparel CPI will come in cold enough to move the needle on Core CPI (and perhaps even Core PCE).
The Core CPI-PCE wedge could prove unstable. The wedge between Core CPI and Core PCE has widened over the past 12 months, predominantly due to the difference in weighting for rent and owners' equivalent rent in CPI vs PCE. That weighting difference is actually going up after the revised CPI weights to start 2024. Nevertheless, there are residual seasonality issues even with respect to the Core CPI-PCE wedge, especially for services that are only captured using PPI data. We would continue to urge caution when interpreting the CPI and PCE data. A cooler CPI print may not look as cool for PCE; a hotter CPI print may not look so hot in terms of PCE.
We are revising down our anticipated Core PCE readings across January and February: Due to the seasonal factor revisions and some specific quirks tied to motor vehicle and apparel pricing, our base-case for Core PCE has moved down from ~0.26% to 0.21%, with a low wedge in January between Core CPI and Core PCE. We continue to emphasize that the tails around the January inflation release are very fat and to not be shocked if they see a 0.1% or 0.4% Core PCE. If Core PCE comes in at 0.1% across both January and February (most of the Feb PCE data comes out during the blackout period before the March FOMC meeting), skeptical Fed officials may ultimately be convinced.
CPI Charts
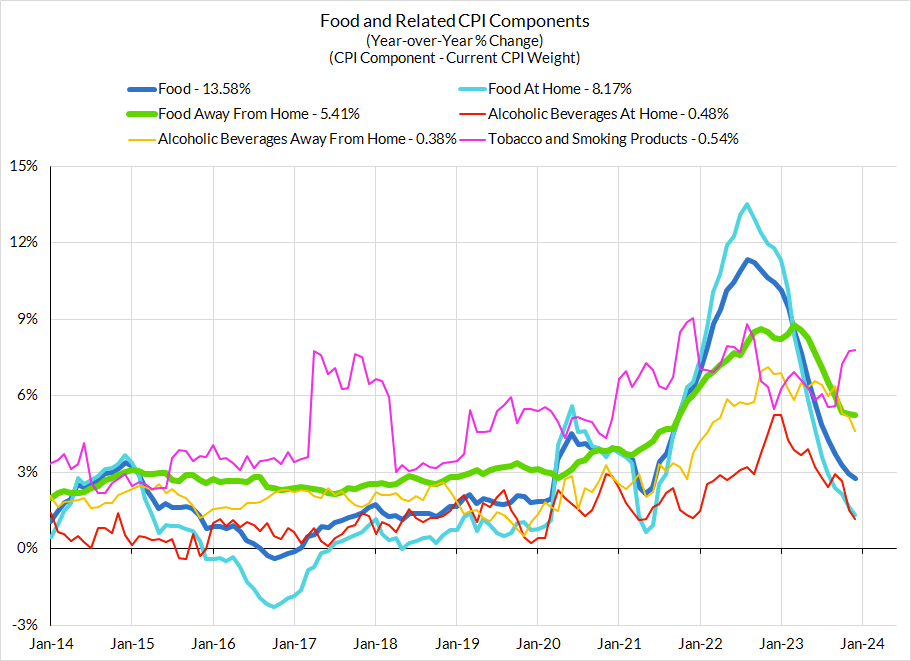
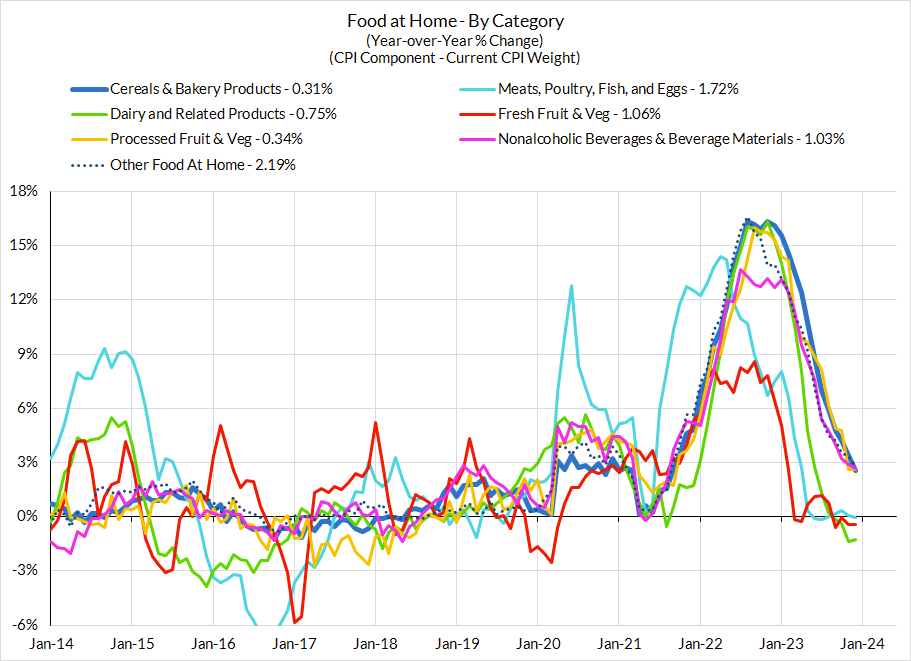
Non-Core CPI Components
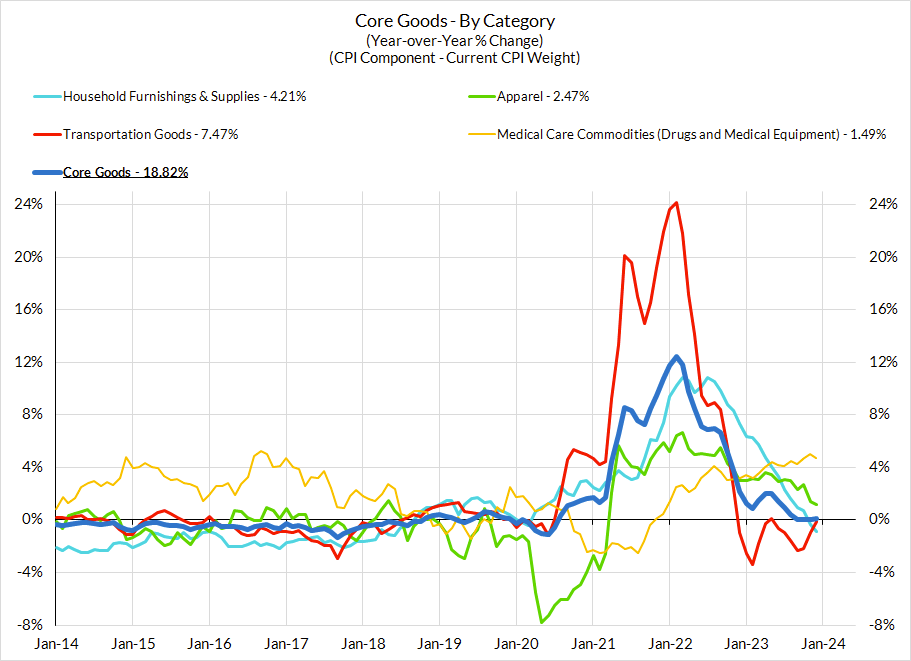
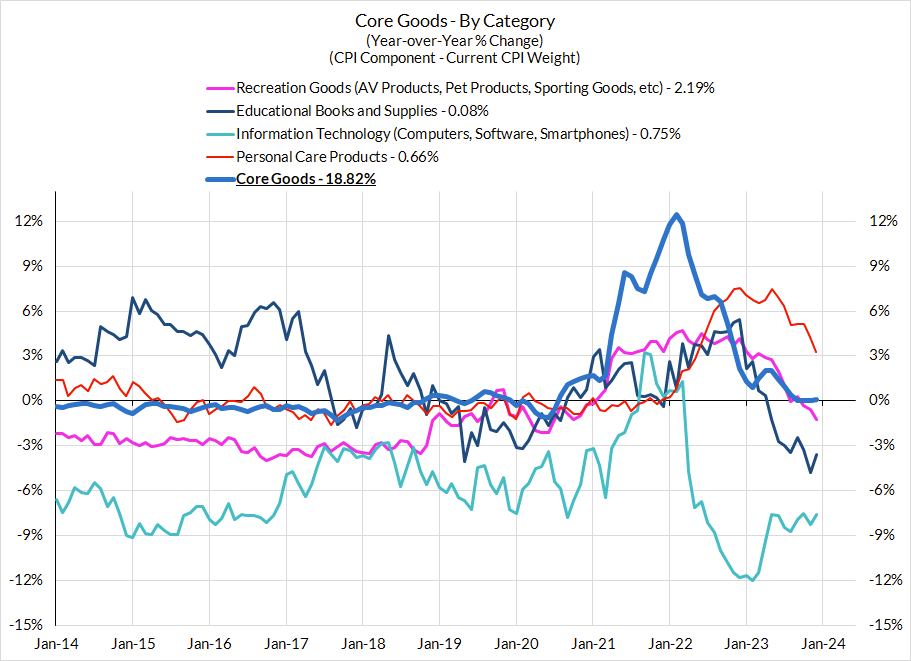
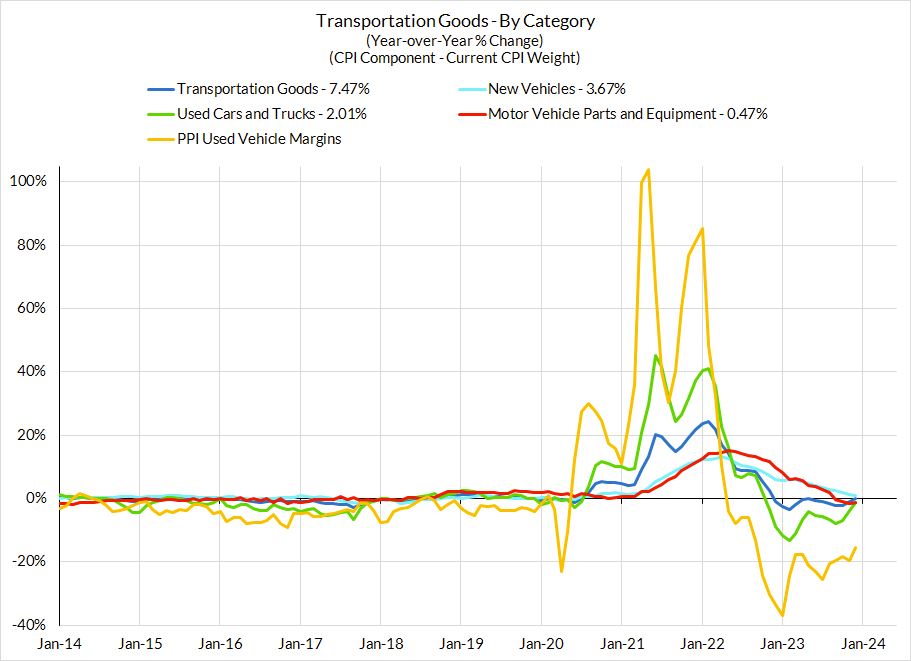
Core Goods CPI Components
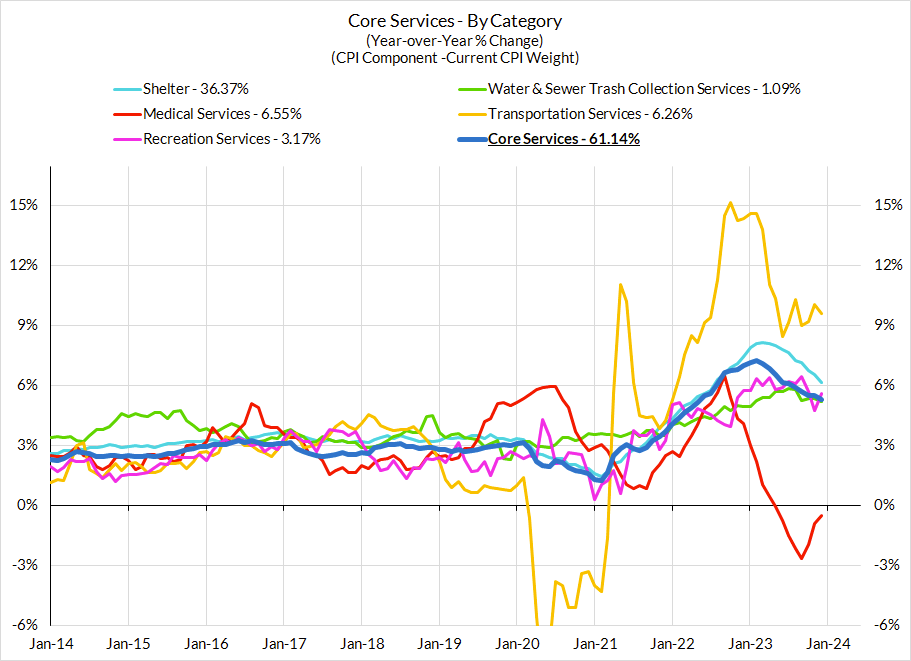
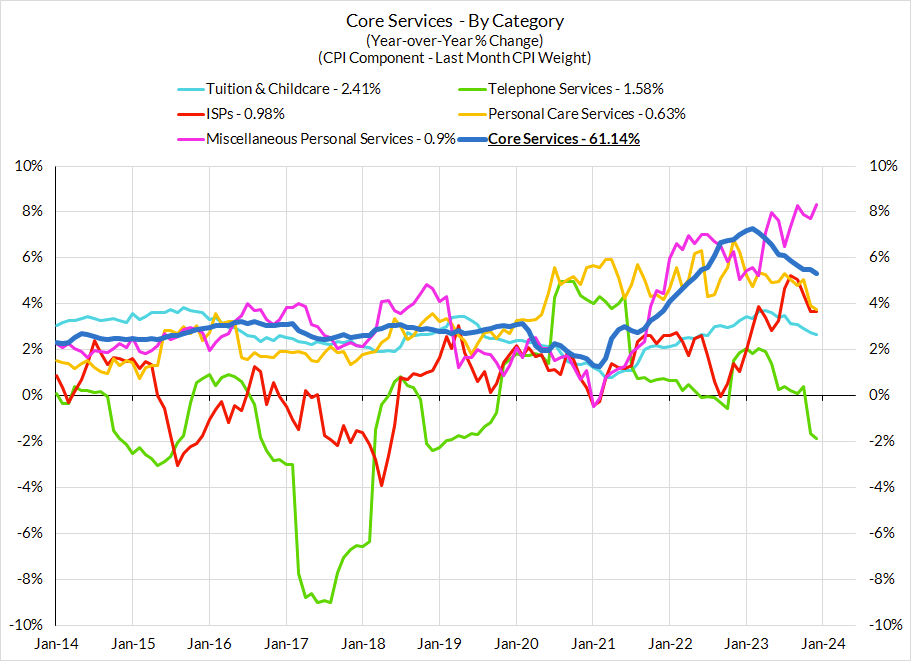
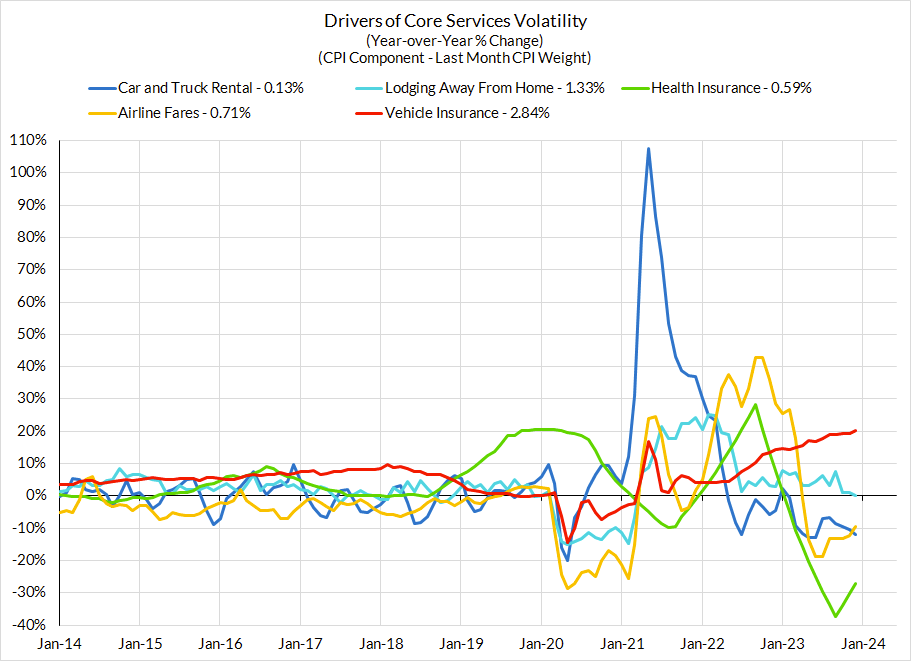
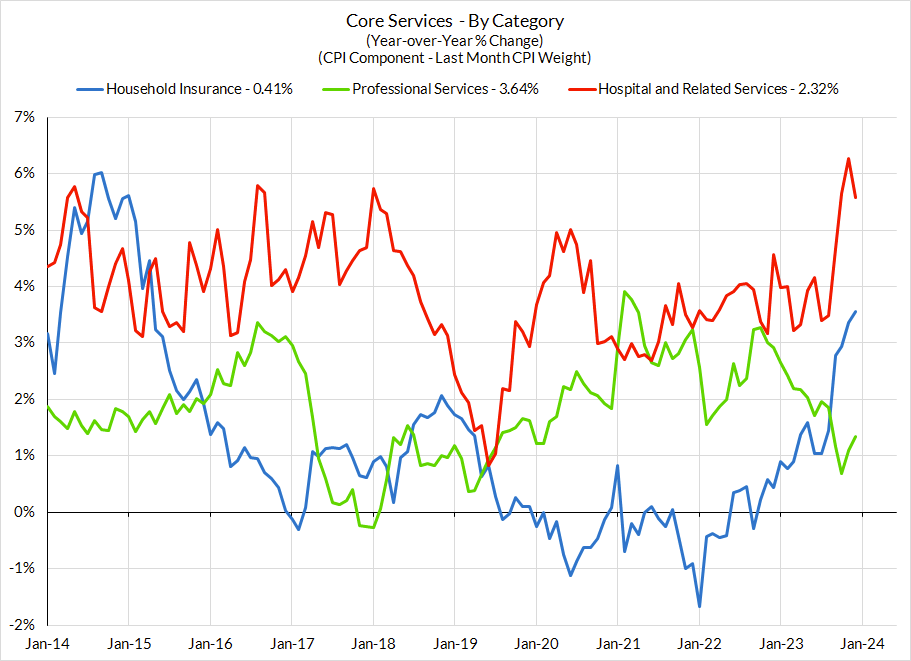
Core Services CPI Components (Not All Feed Into Core PCE)
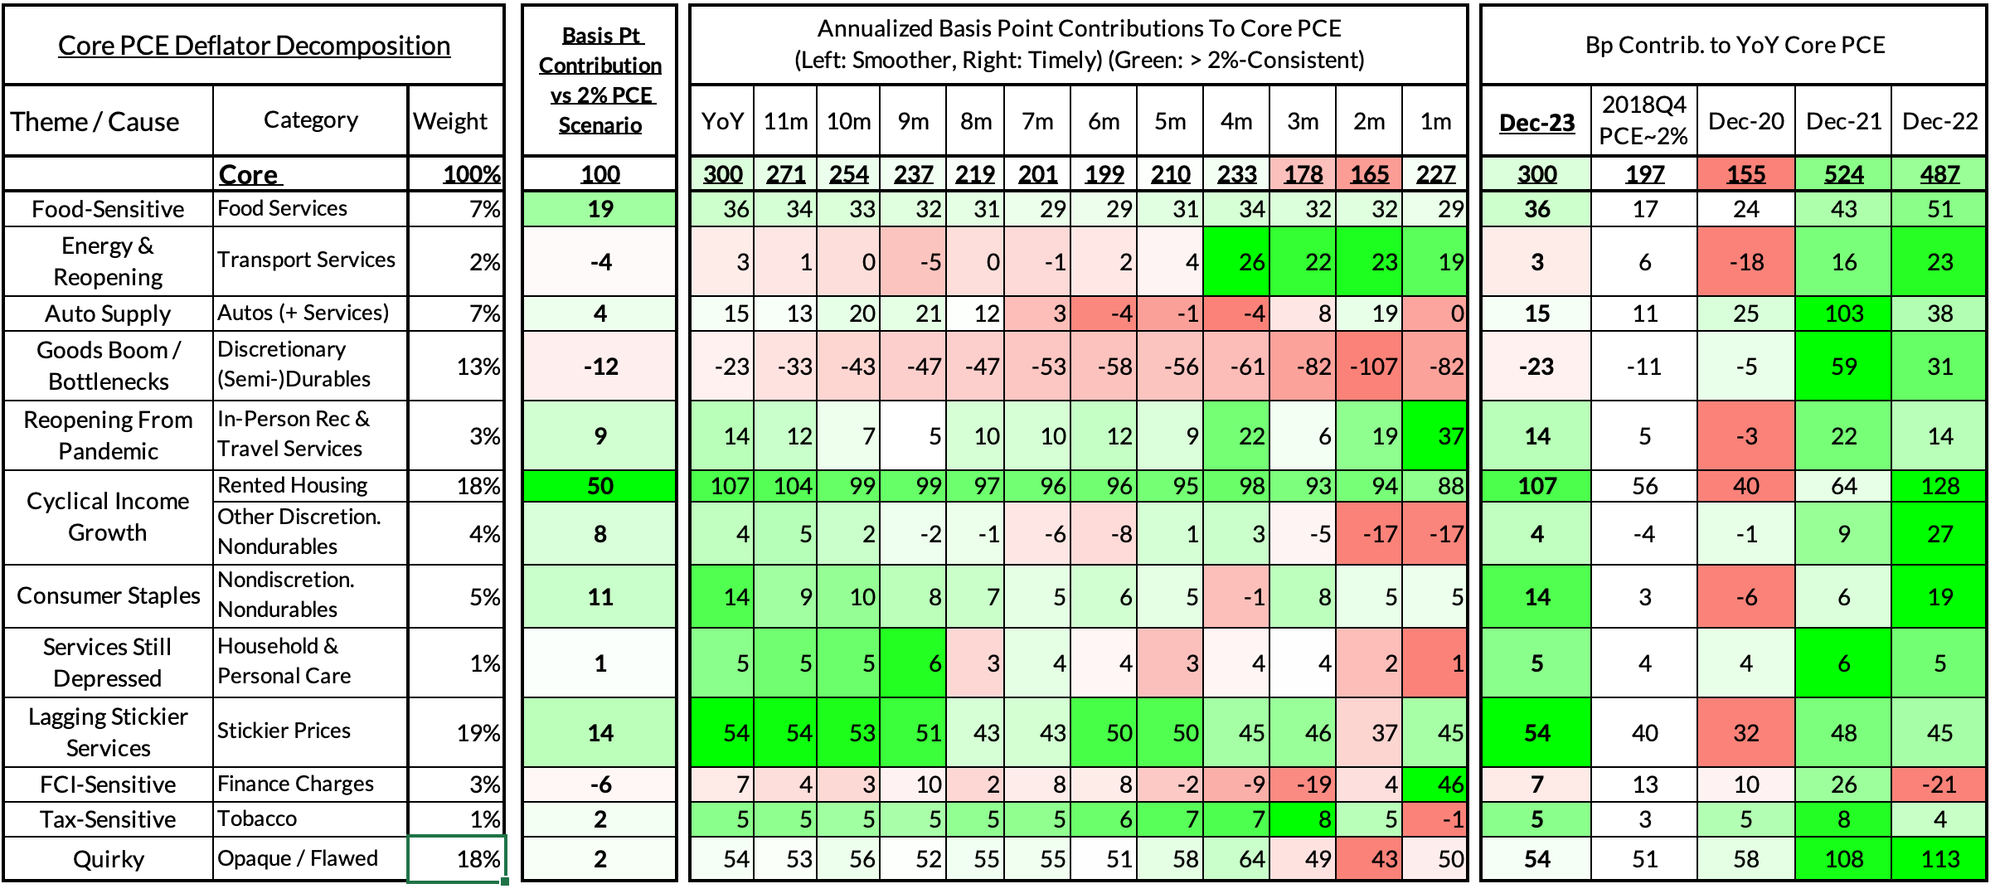
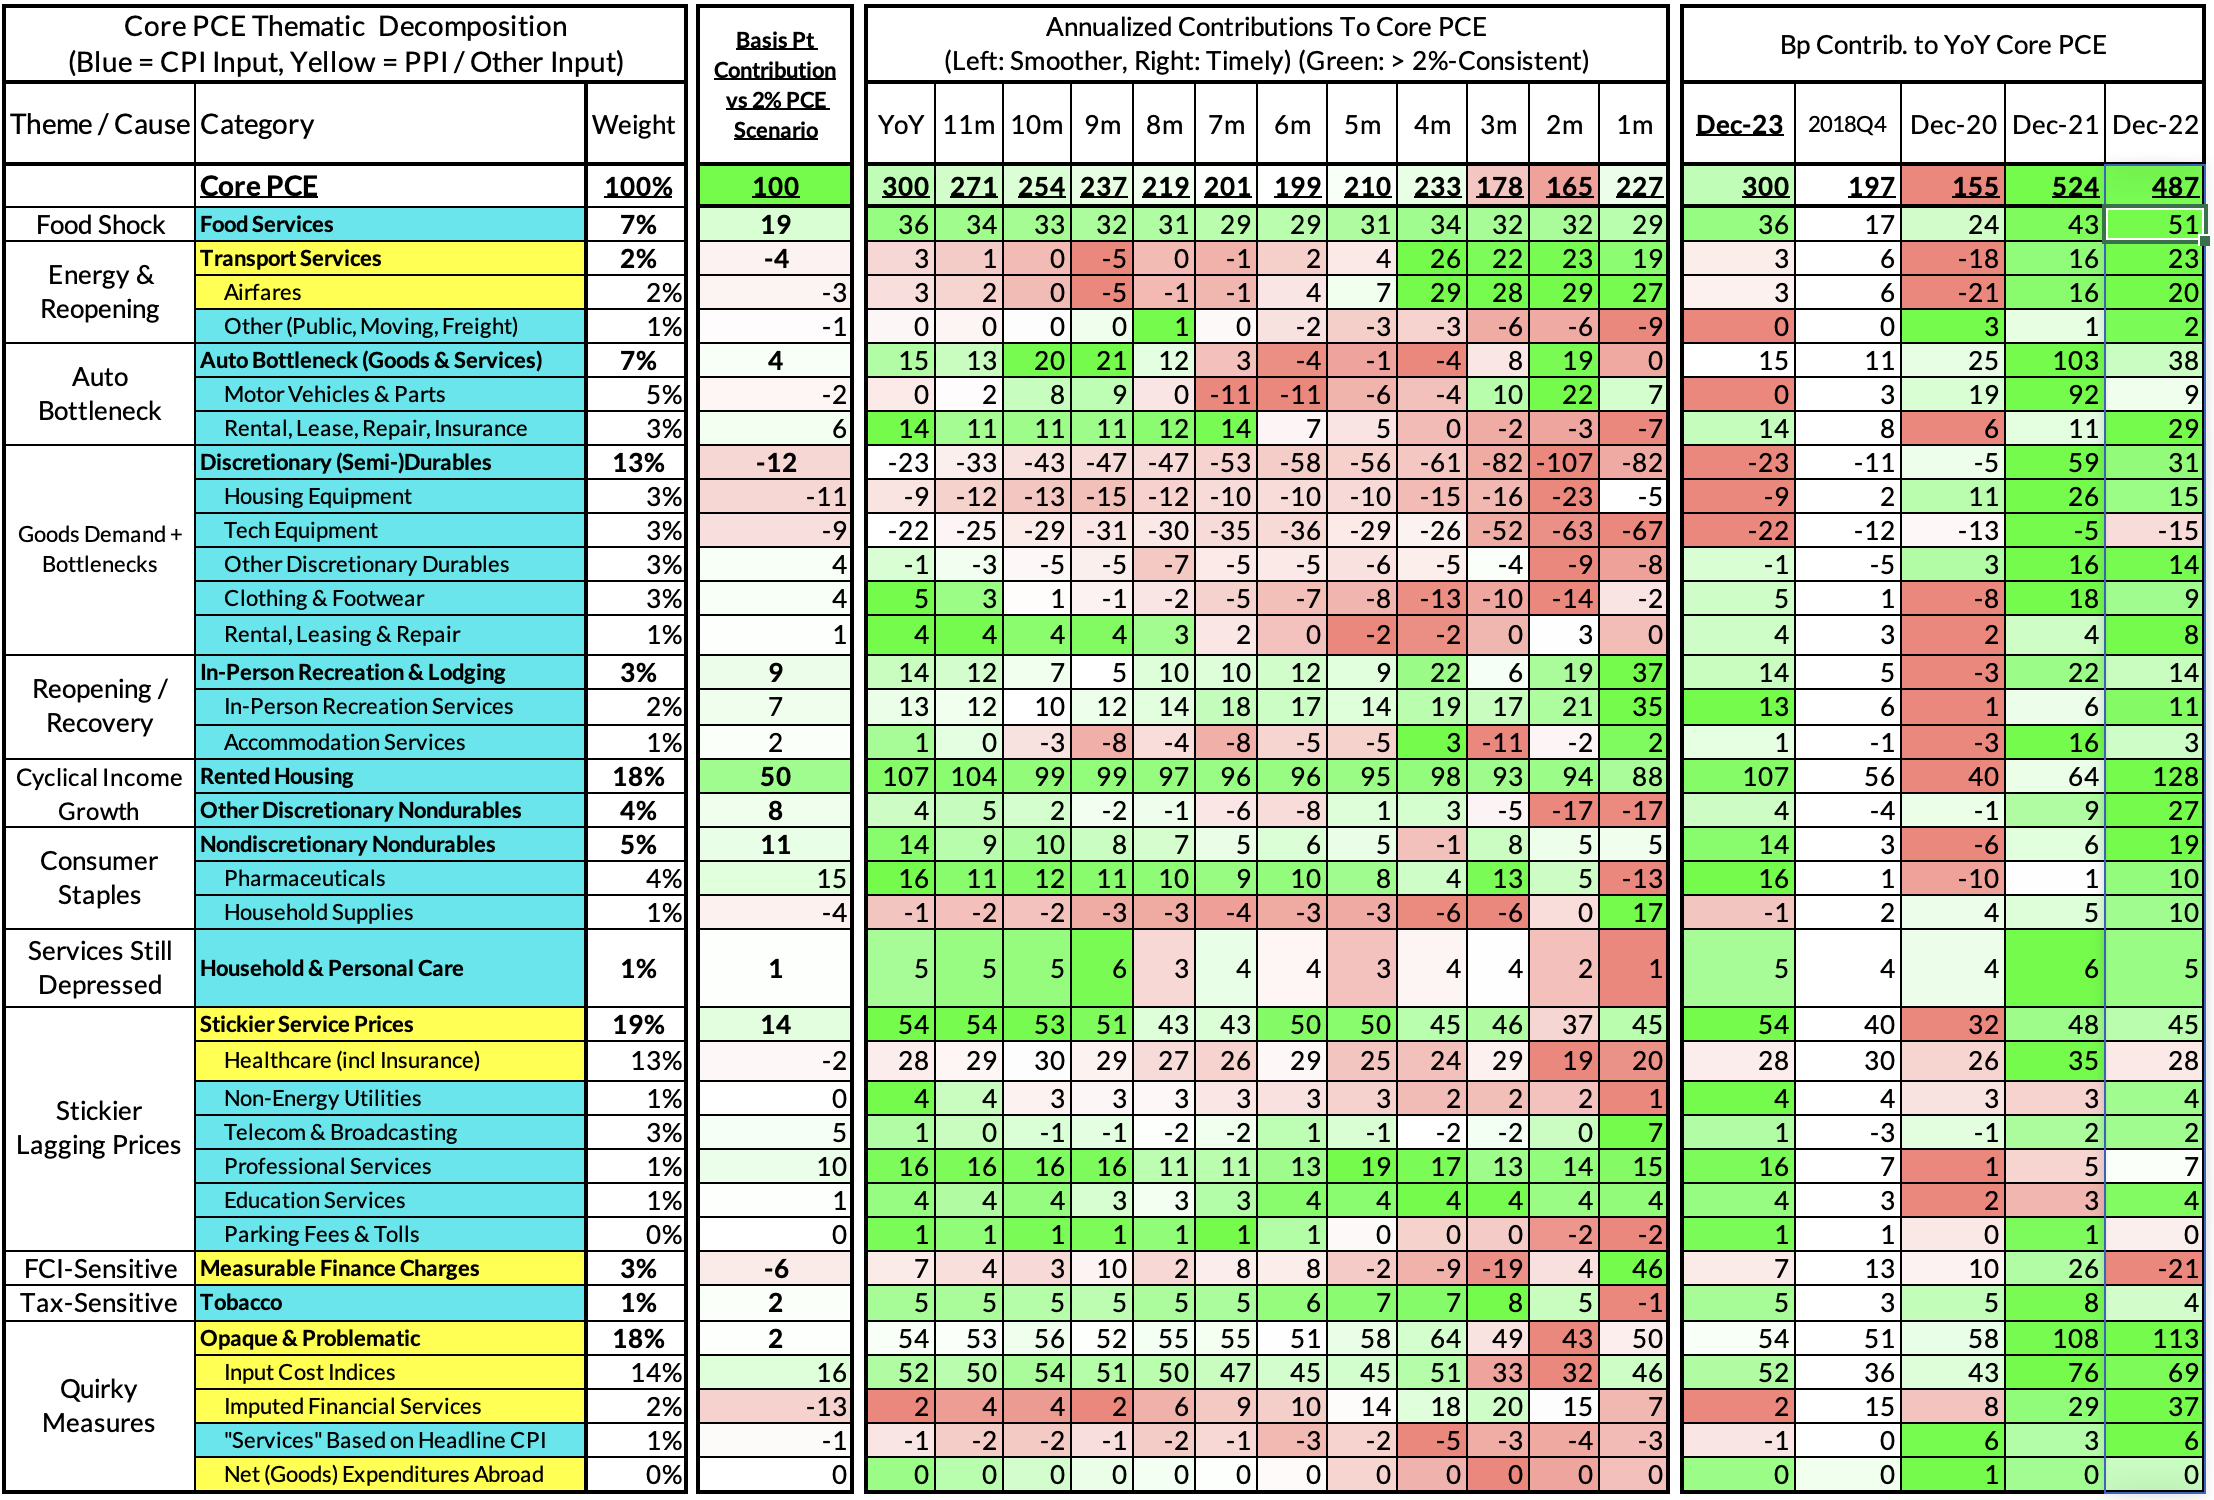
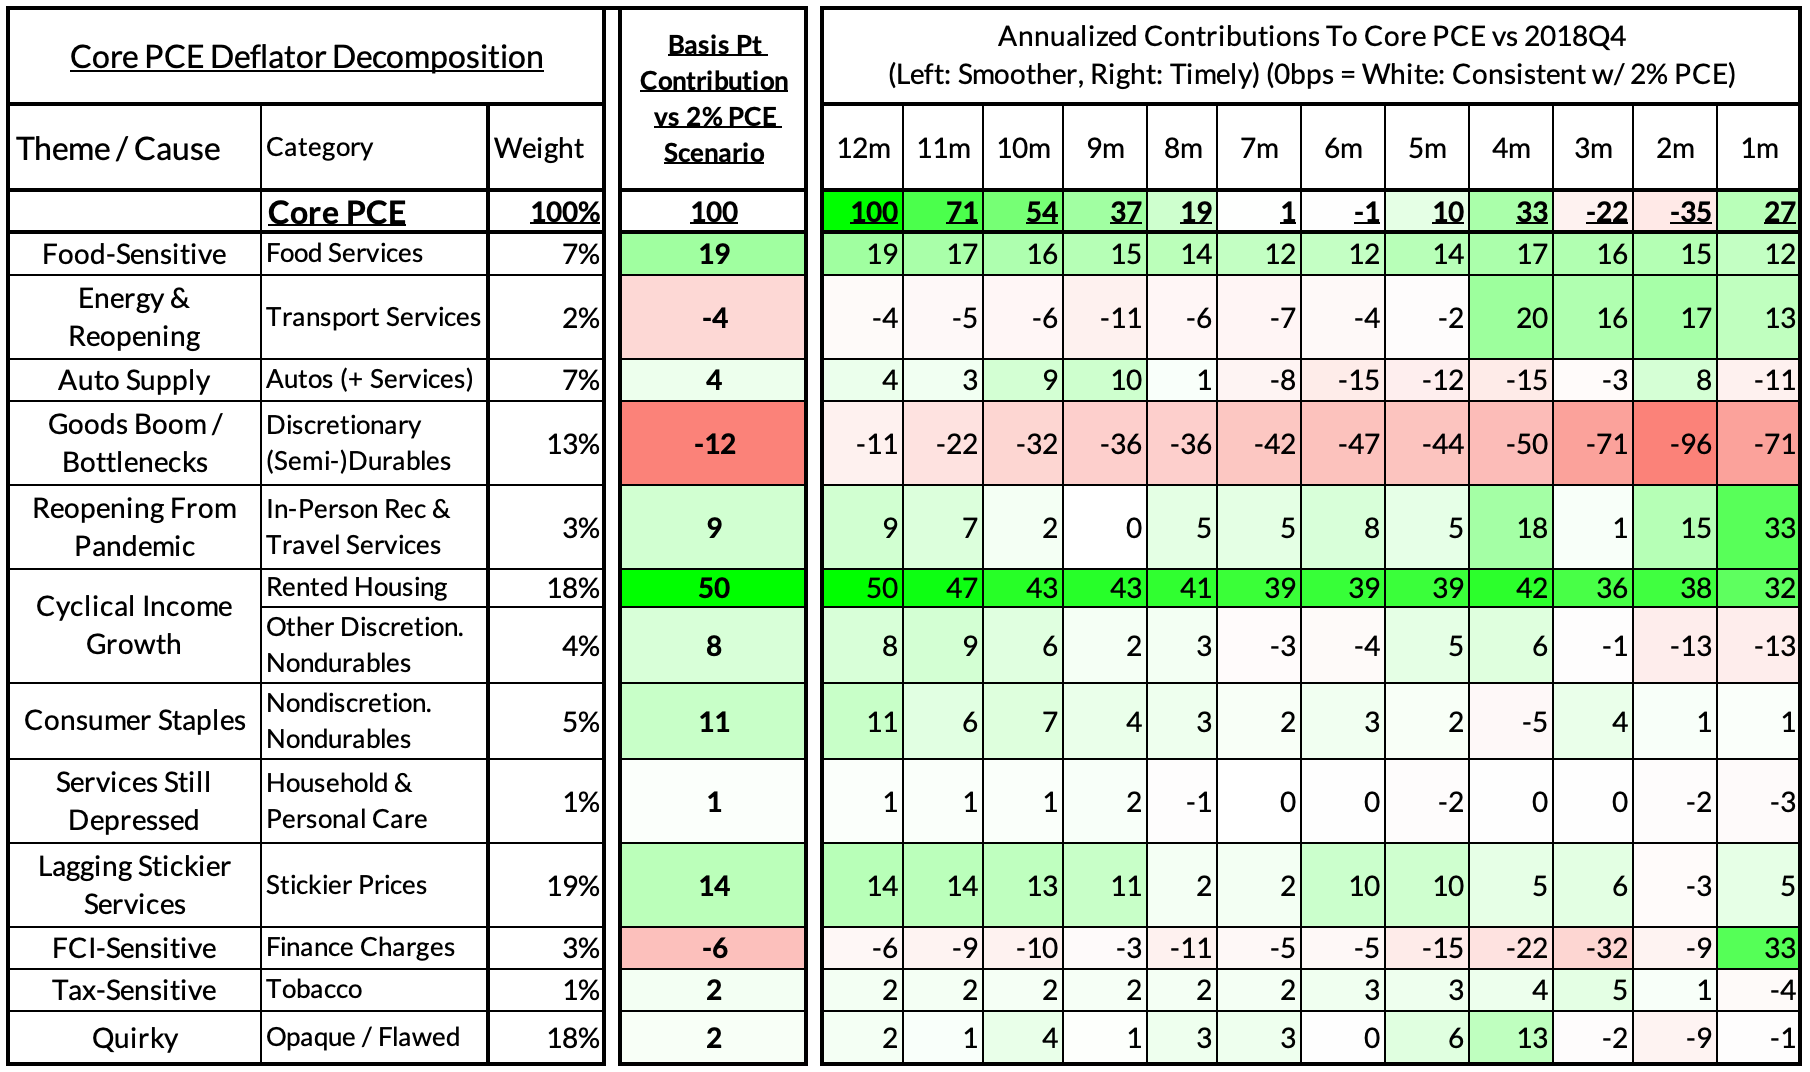
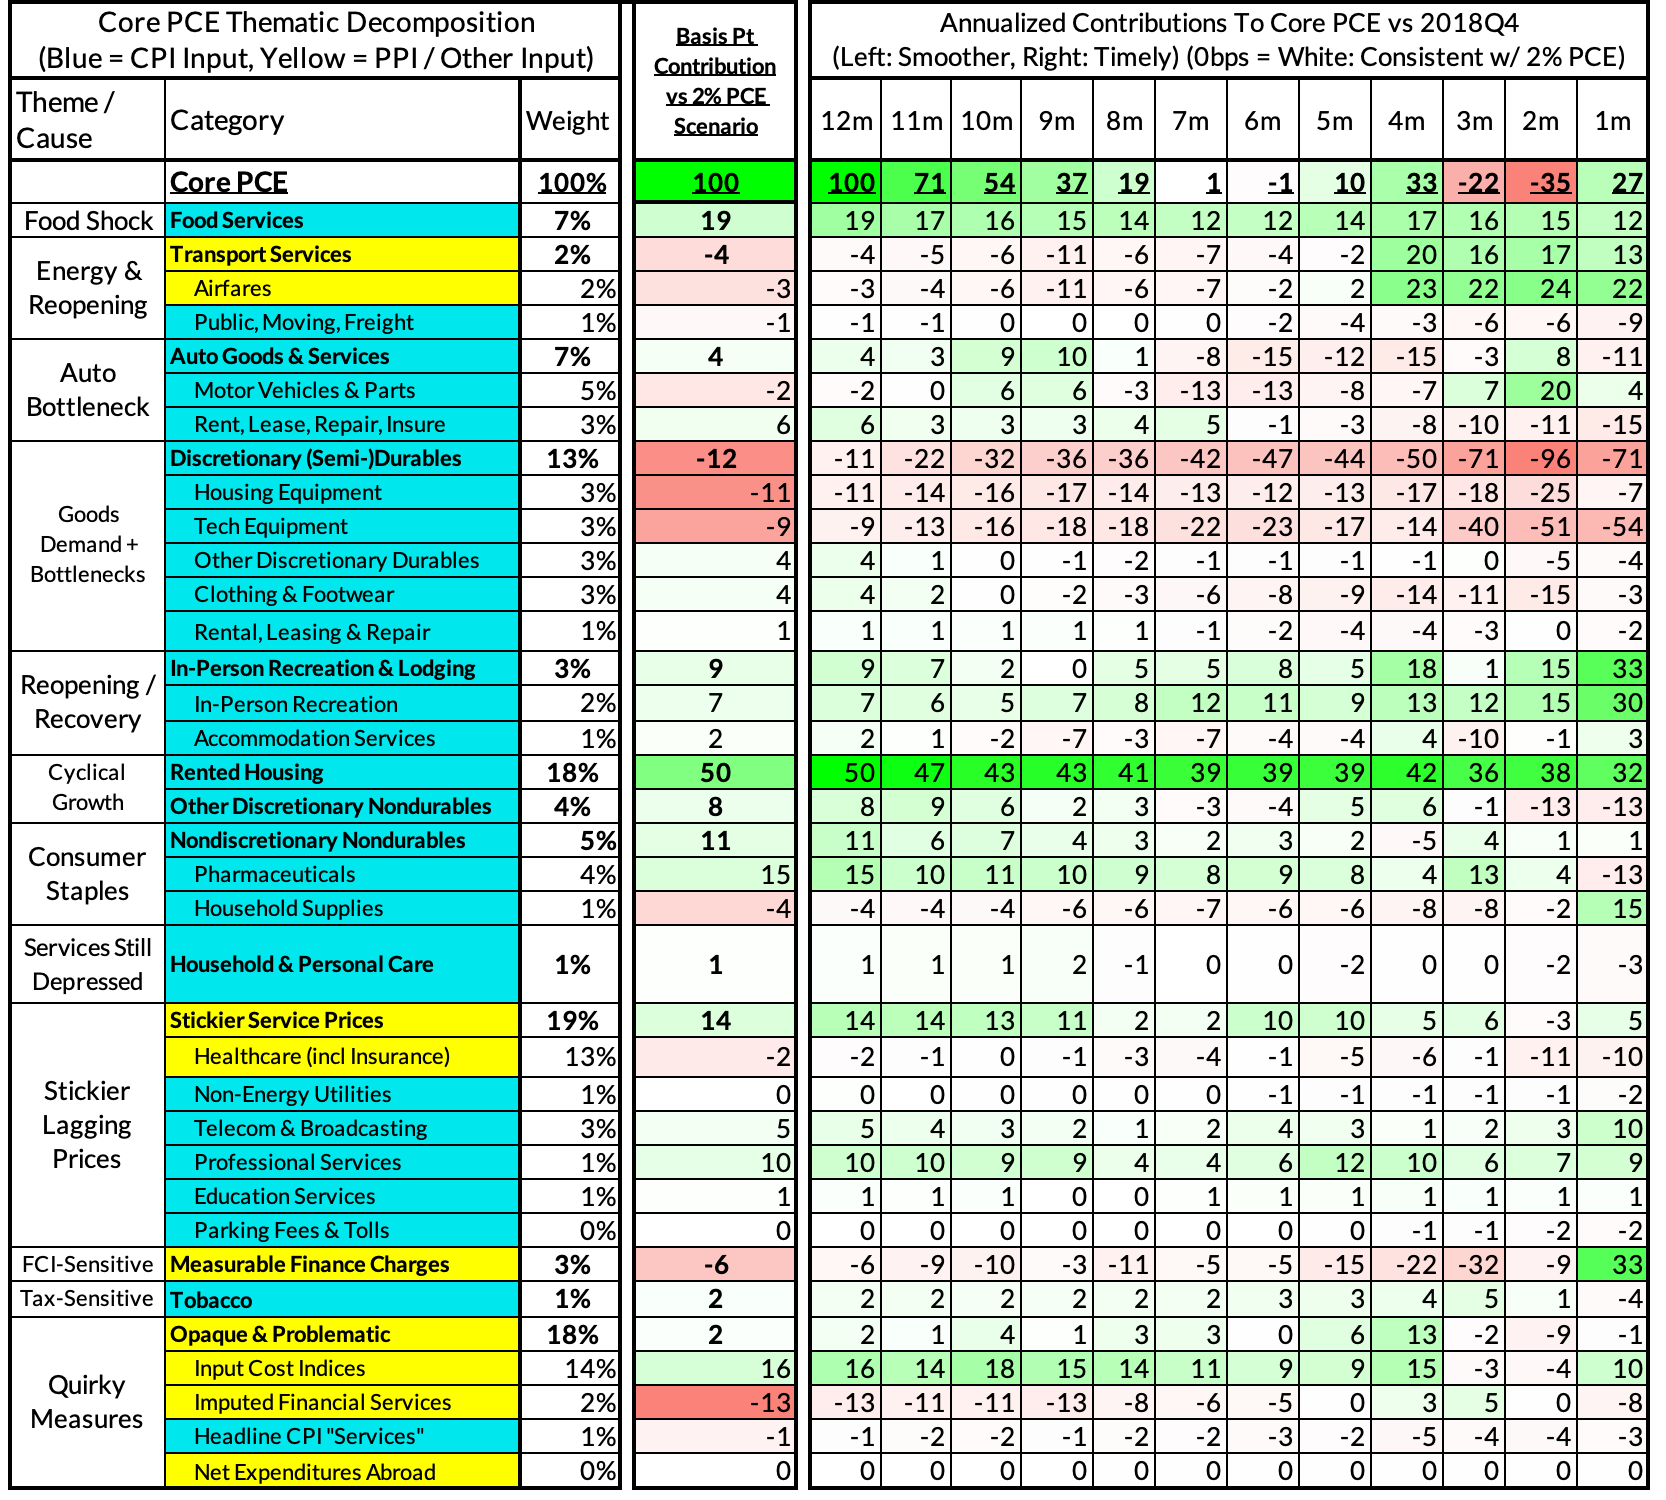
For the Detail-Oriented: Core PCE Heatmaps
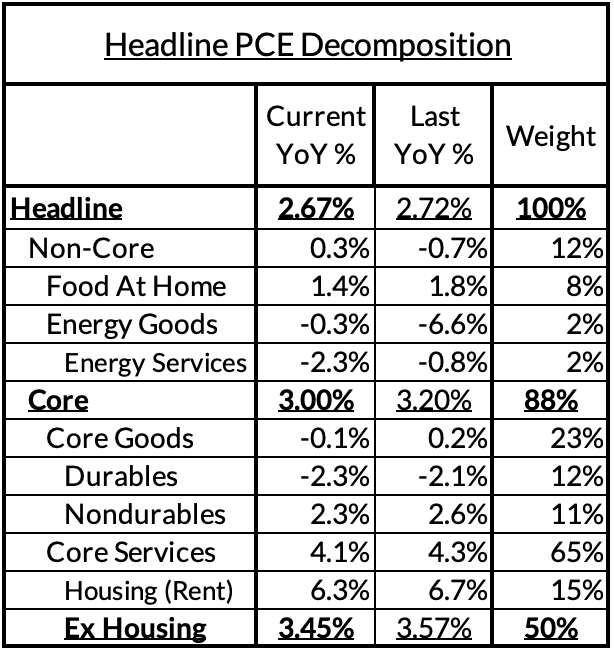
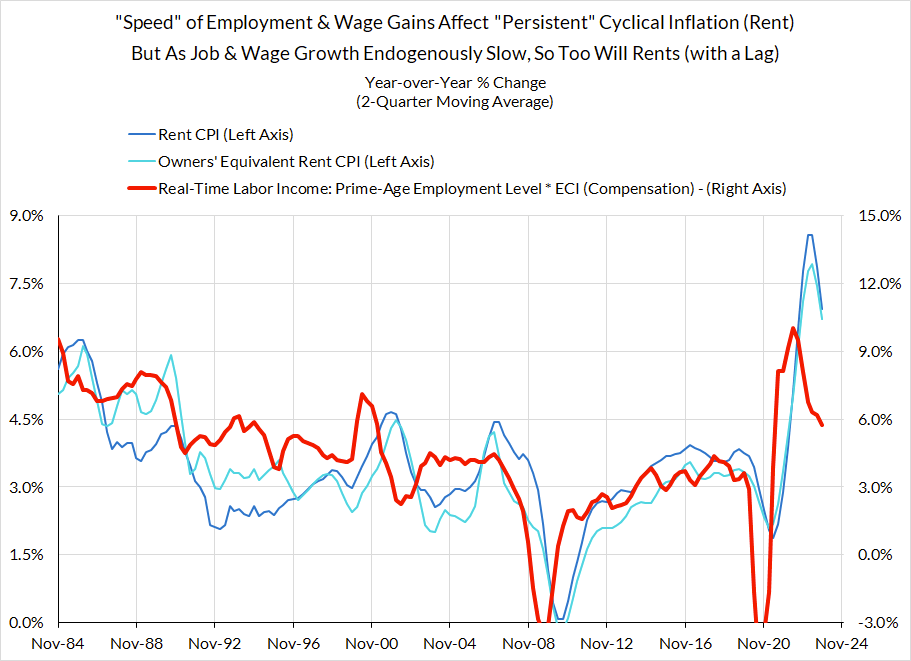
Right now Core PCE (PCE less food products and energy) is running at 3.00% year-over-year pace as of December, 100 basis points above the Fed's 2% inflation target for PCE. That overshoot is disproportionately driven by catch-up rent CPI inflation in response to the surge in household formation (a byproduct of rapidly recovering job growth) and market rents in 2021-22. Rent is contributing 50 basis points to the 95 basis point core PCE overshoot.
There are other contributors to the overshoot:
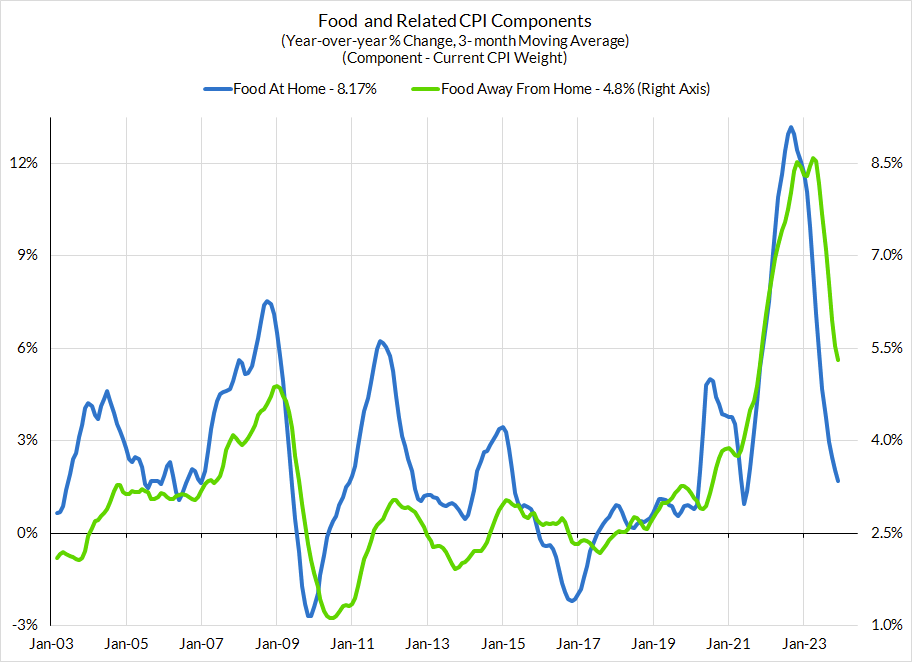
Some more supply-driven (food inputs likely added 19 basis points to the overshoot)
Some more demand-driven (in-person recreation and travel services likely added 9 basis points to the overshoot)
So with demand- and supply-side drivers (consumer staples and discretionary goods likely added 7 basis points).
Some oddball segments have offsetting effects (measured financial service charges now subtracting 6 basis points, while contributions from input cost indices and imputed financial services likely adding 3 basis points to Core PCE vs 2%-consistent outcomes).
The final two heat maps below gives you a sense of the overshoot on shorter annualized run-rates. December monthly annualized core PCE yielded a 27 basis point overshoot vs 2% target inflation (2.27% annualized).
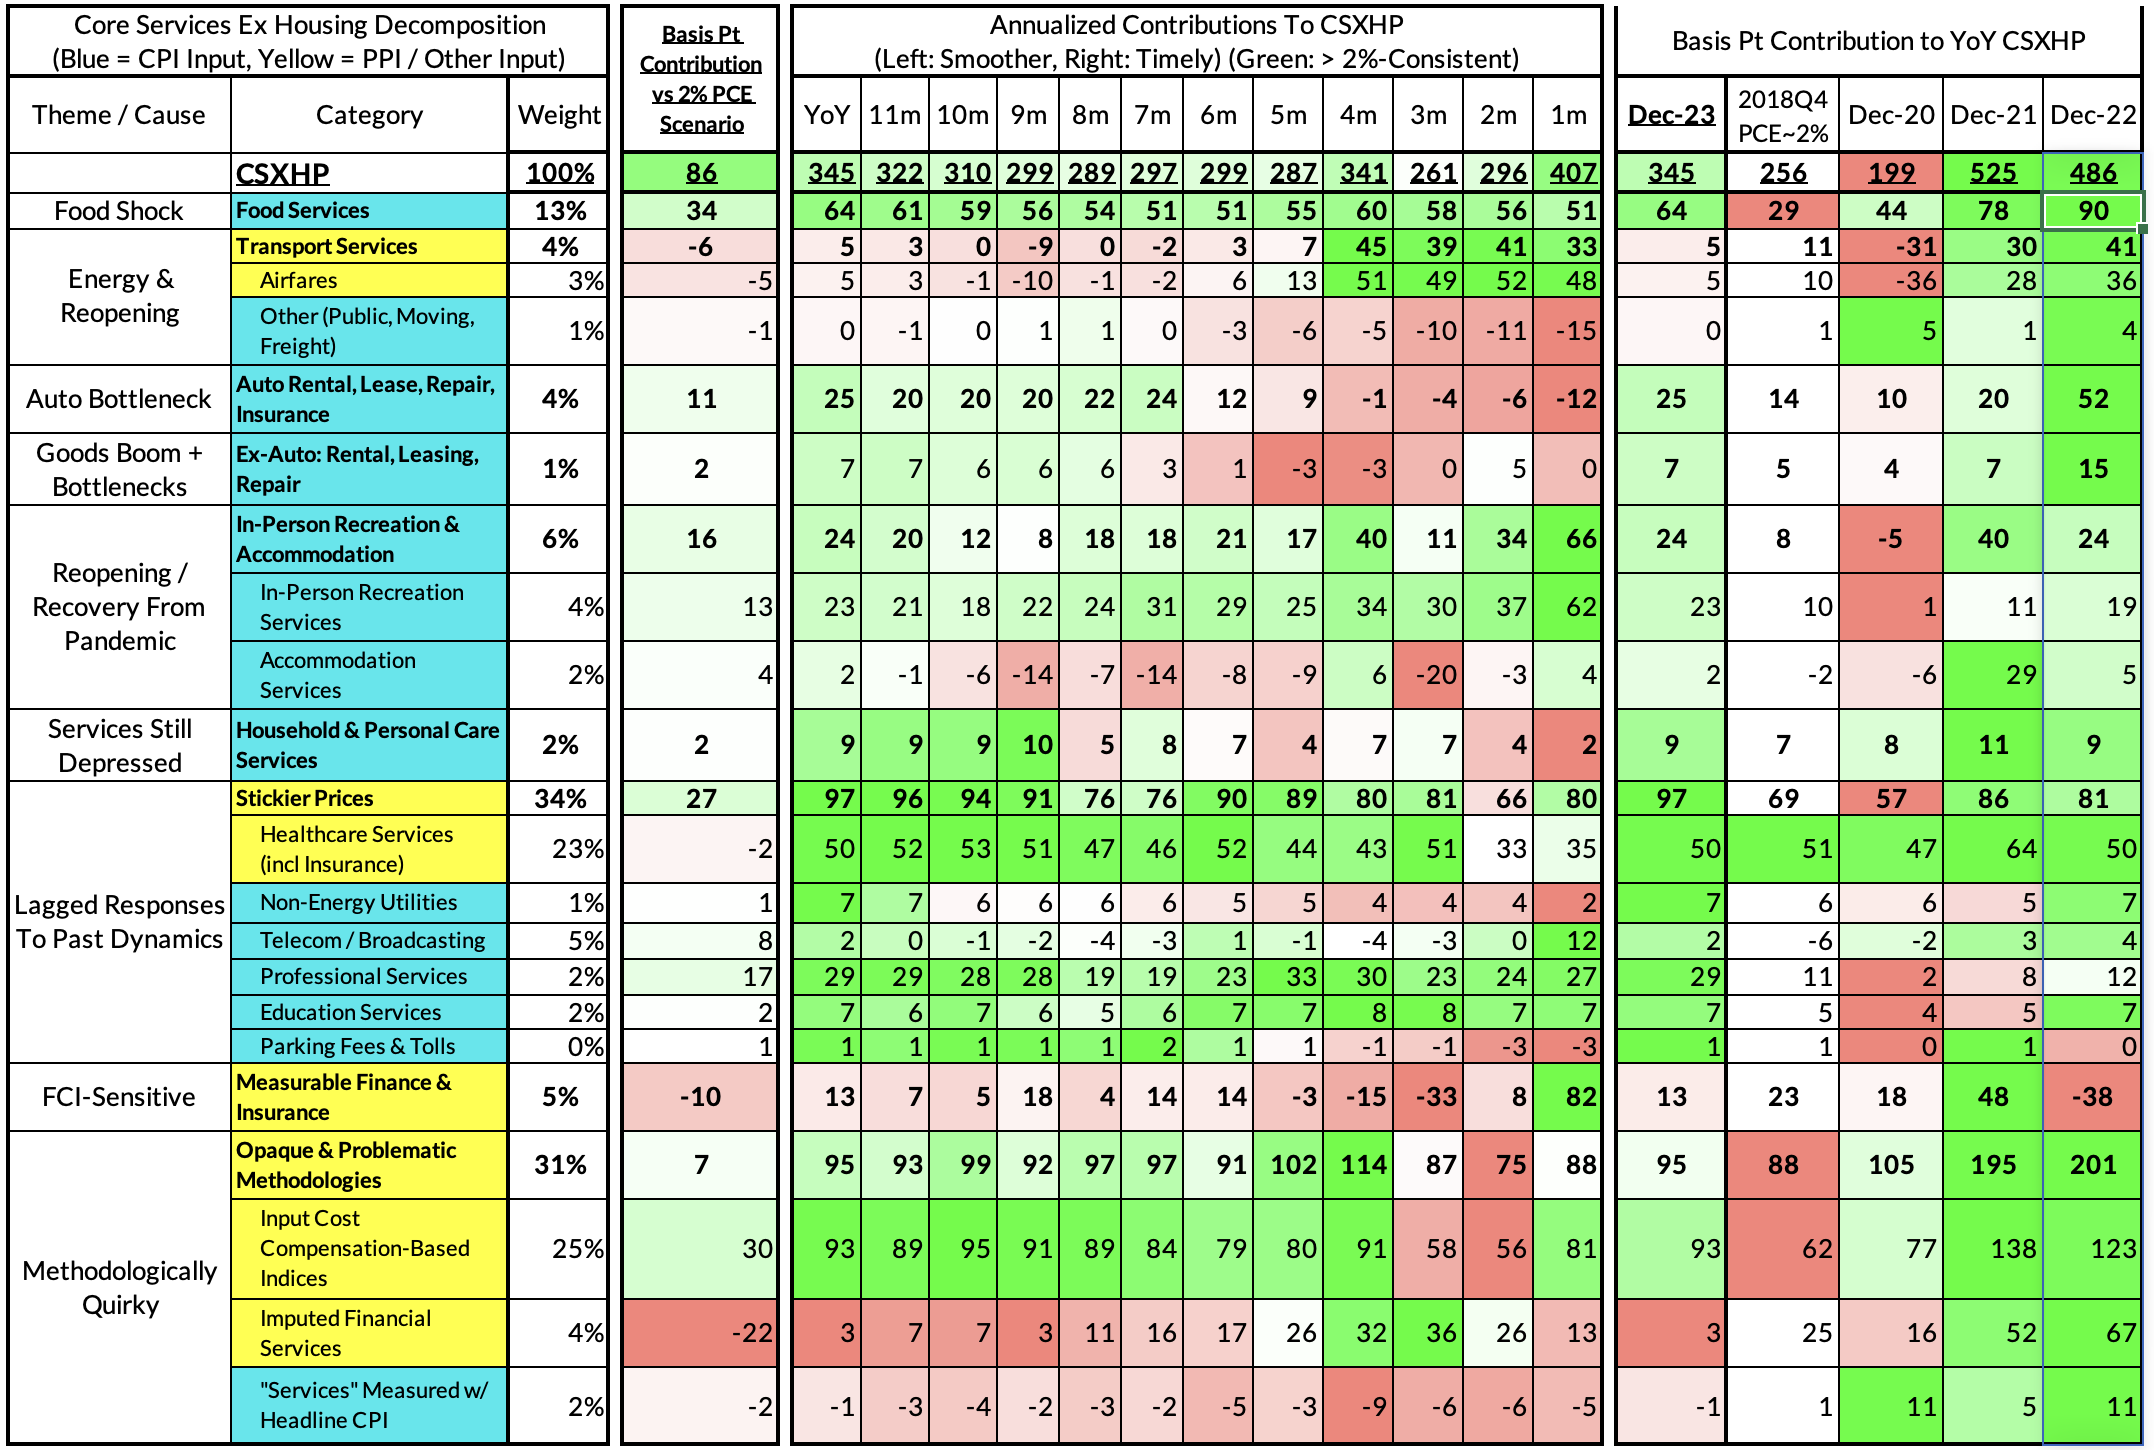
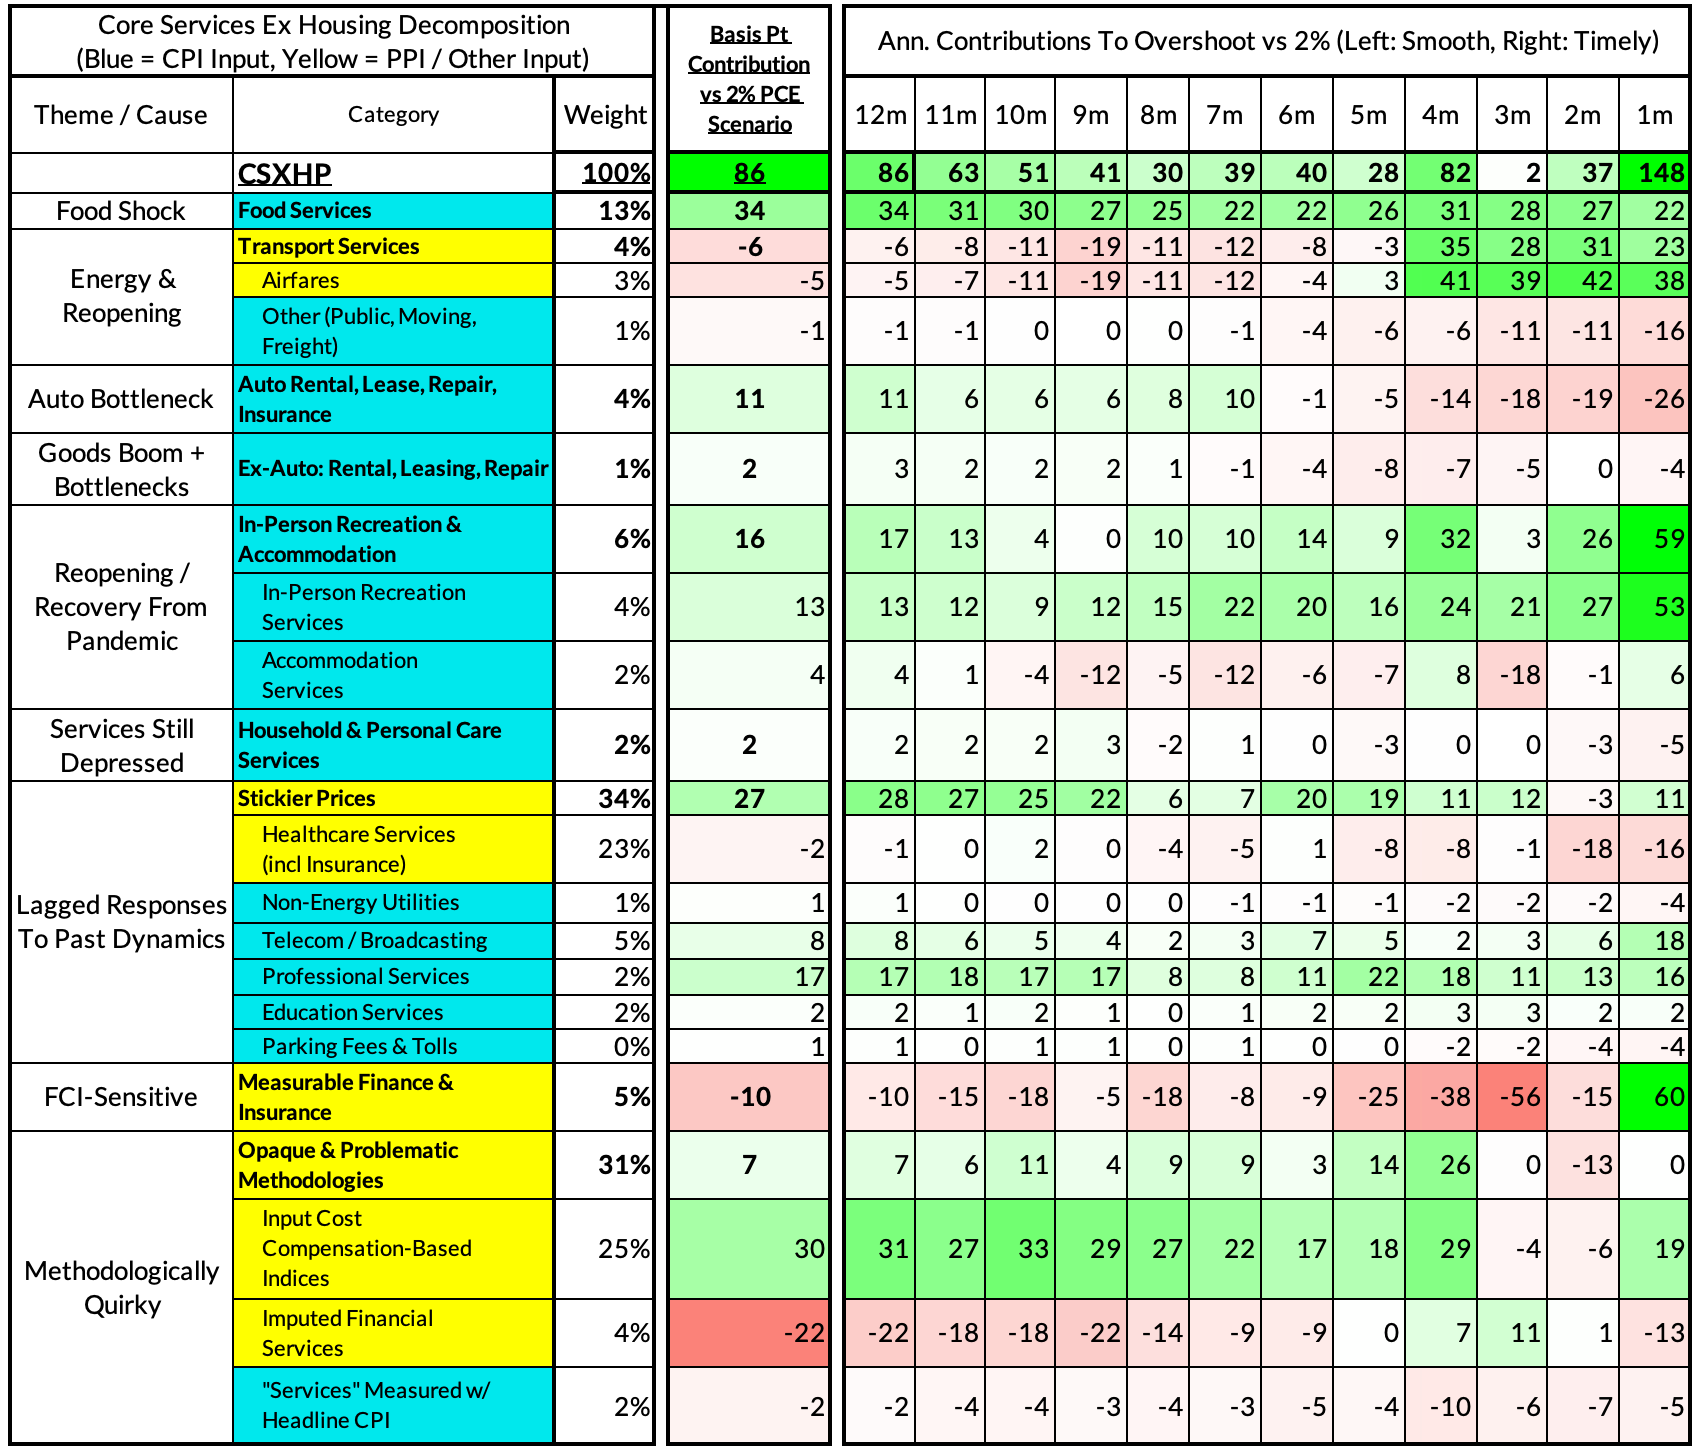
For the Detail-Oriented: Core Services Ex Housing PCE Heatmaps
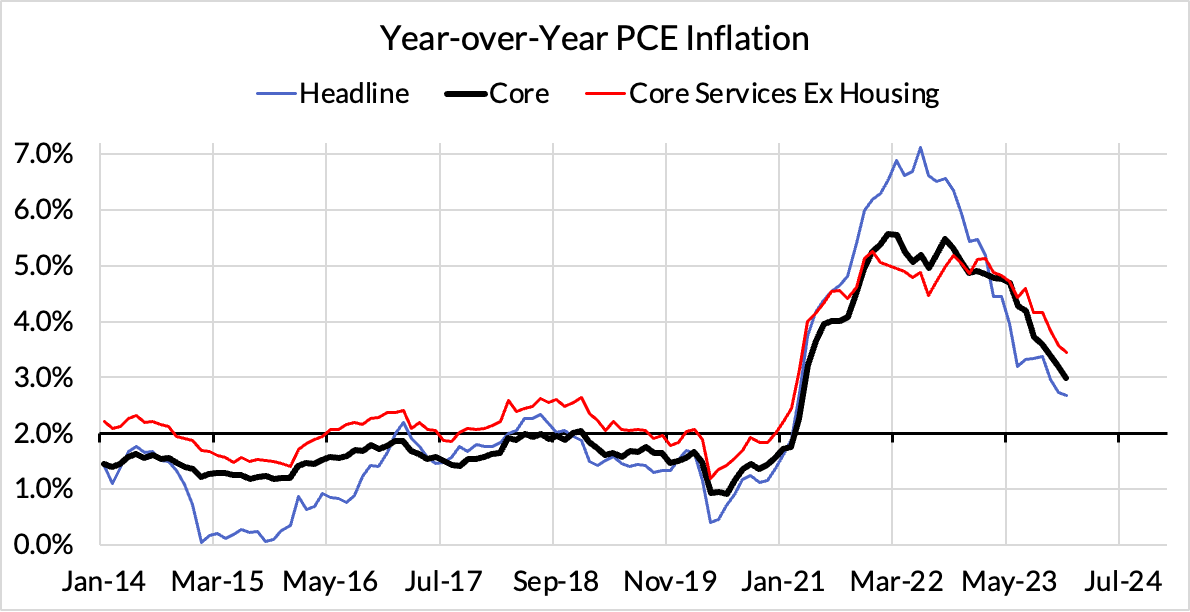
The December growth rate in "Core Services Ex Housing" ('supercore') PCE ran at 3.45% year-over-year, an 86 basis point overshoot versus the ~2.59% run rate that coincided with ~2% headline and core PCE.
December monthly supercore ran at a 4.07% annualized rate, a 148 basis point overshoot of what would be consistent with 2% headline and core PCE.