This is a truncated version of the preview initially made available to our exclusive distribution this past Friday. Core-Cast is our nowcasting model to track the Fed's preferred inflation gauges before and through their release date. The heatmaps below give a comprehensive view of how inflation components and themes are performing relative to what transpires when inflation is running at 2%.
Most of the Personal Consumption Expenditures (PCE) inflation gauges are sourced from Consumer Price Index (CPI) data, but Producer Price Index (PPI) input data is of increasing relevance, import price index (IPI) data can prove occasionally relevant. There are also some high-leverage components that only come out on the day of the PCE release.
If you'd like to start a 90-day free trial of our exclusive content, you can do so using this link. If you have any questions or would like to see samples of our past content, feel free to get in touch with us.
Summary
- We remain inflation optimists for the rest of 2024 but the timeline for meaningful relief has proven to be longer than what we initially anticipated to start the year. Not only was January and February exceptionally strong, but so too March. The reversal of aggressive 2023H2 discounting in for information technology goods and broader durable goods residual seasonality pushed up Core CPI inflation more aggressively than we anticipated.
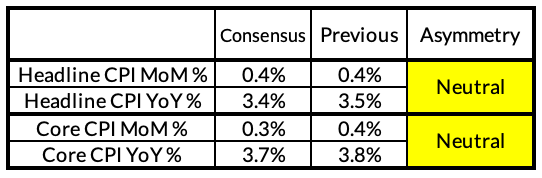
- We still expect some dissipation of what we see as more temporary Q1 pricing adjustments in goods, implying some Core CPI disinflation (0.30% m/m) relative to Q1 (0.38%) but basically in line with consensus (0.3%). Core CPI outperformance relative to our forecasts and Q4 was largely a function of outperforming goods inflation but it's still hard to see a causal smoking gun that has outsized relevance beyond Q1. While core services CPI will continue to run strong, these effects were more closely anticipated and far less relevant to the trajectory of Core and Supercore PCE.
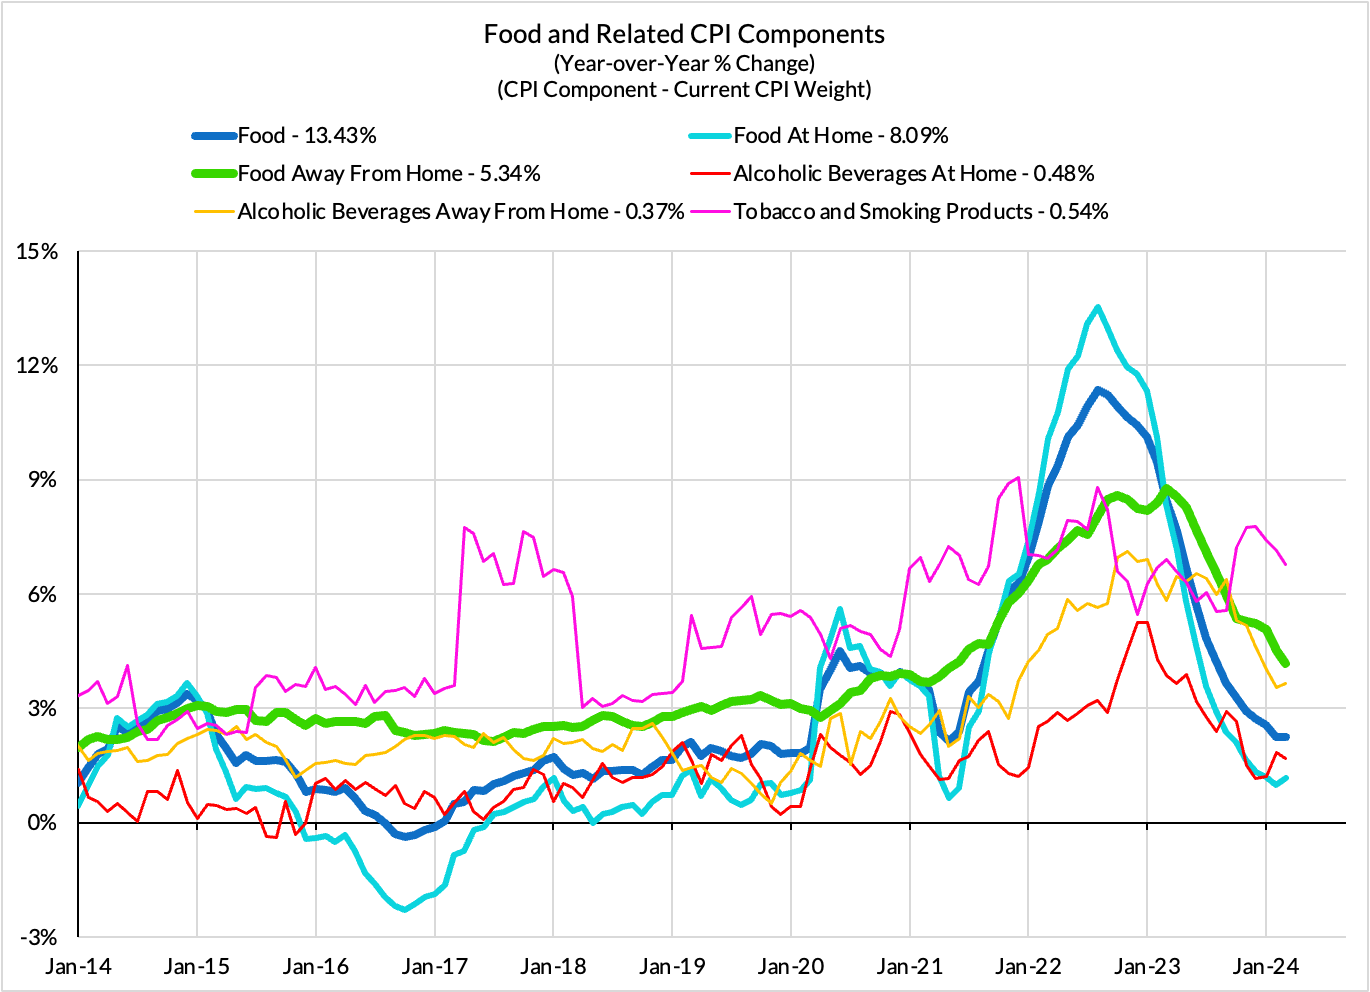
- Our base-case forecast for Headline CPI (0.34% m/m) shades to the lower side of consensus (0.4%). Headline CPI inflation is also subject to two-sided risks, as there are lagged impacts from past diesel and natural gas price declines of relevance to food and energy services, but also local upticks in spot natural gas prices that might prove more relevant. Food services inflation is of outsized relevance because it was arguably the best disinflationary surprise of Q1 and counts for Core and Supercore PCE; we hope and expect to see further signs of progress here.
- The Core CPI-PCE wedge should begin widening further as financial services inflation dissipates: The wedge has been especially wide in the past 18 months but has actually narrowed in the last 3 months as the effects of equity price appreciation have filtered into measured financial service prices. As equity prices have flat-lined in late March and April, the pace of financial services inflation should– with some lag and scope for revision—also slow down. We also expect slower airfare PPI inflation in the coming months after a big pop earlier. As a result, we expect Core PCE to run at a 0.19% m/m pace.
- What drove Q1 strength? We see three main reasons: (1) goods prices were subject to more residual seasonality than we anticipated, (2) information processing equipment (computers, electronics) saw more idiosyncratic reversals of aggressive 2023H2 discounts, and (3) the full impact of rapid equity price appreciation in late Q4 and early Q1 on financial services PPI/PCE was underestimated in Q1. While new sources of upside risk might still emerge in a couple of pockets (some recreation and professional services), we also see some bigger downside risks emerging (rent, OER, automobiles) that ultimately pay off, even if not imminently enough to offset the Q1 burst.
Forecast Details
Our bottoms-up forecast reflects a few different facts:
- The goods dis-deflation dynamic in Q1 should begin to more meaningfully reverse in Q2. We continue to see evidence that goods prices run soft in H2 (for CPI purposes Q3, PCE purposes Q4) but very firm in Q1. As we exit Q1 and advance through the year, there should be renewed deflation, especially now that consumer spending looks increasingly normal in pace and composition alongside supply-side benefits from supply chain healing and commodity price stabilization.
- There are downside risks coiling in rent, OER, used and new vehicles, but they probably do not fully pay off in April. We are adopting a more conservative used cars forecast for April but we see more evidence that there is still more used car price deflation to go. More importantly, new car prices have been substantially deflating, but new vehicles CPI continues to lag these dynamics. Same story for rent and OER, where we see signs of a bigger capitulation forthcoming...just not modally likely to arrive as early as April (seasonal factor revisions have pushed and increased the likelihood of bigger drops into the summer of this year).
- Nonhousing services CPI should see some relief: We are not optimistic about vehicle insurance CPI, but we expect to see automobile rental and leasing costs show some relief finally. Airfares are likely to still punch strong, but residual seasonality tied to lodging suggests a bigger correction forthcoming in either April or May.
What Went Wrong In Q1?
We do deep-dives into component- and micro-causal-level dynamics within the inflation data not so that we can say "except this" or "except that" but as a method to hypothesis test which macroeconomic dynamics are proving most relevant (different macro causes have different micro implications).
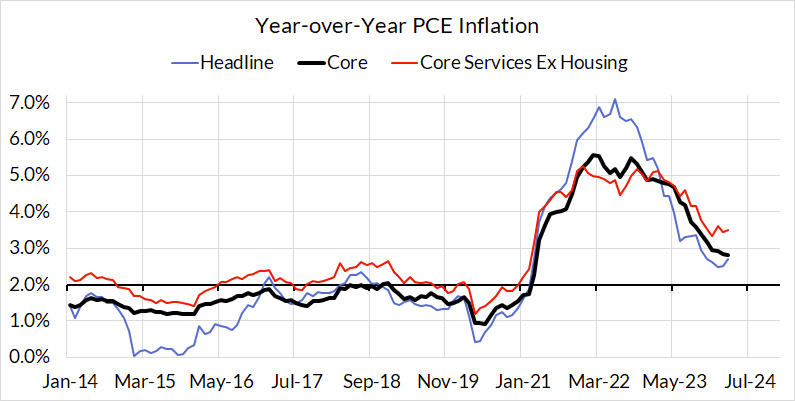
We were burned for being excessively optimistic about March inflation data and with the benefit of hindsight, Q1 holistically took on a substantially more inflationary character in comparison to 2023Q4. Whereas Core PCE averaged 0.13% m/m in the final three months of 2023, Core PCE averaged 0.36% m/m in the first three months of 2024. We were largely open to the idea that Q1 had fat tails, including substantial upside risk tied to residual seasonality (Q1s running hotter post-pandemic than what seasonal adjustment can agnostically anticipate). What transpired came in at the top-end of our wide anticipated range.
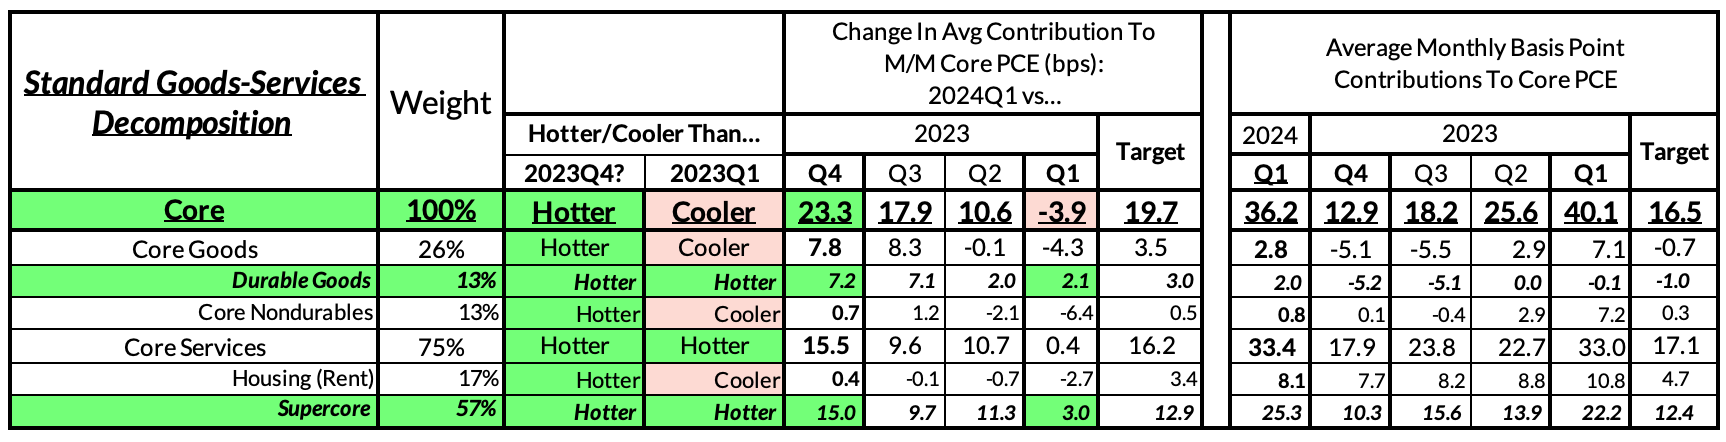
As Chair Powell rightly noted in his May FOMC press conference, there were inflation disappointments visible both in core goods and core nonhousing services prices. Within the 0.23% acceleration in monthly 2024Q1 Core PCE prints relative to 2023Q4 (0.36% vs 0.13%), a third of the acceleration came from durable goods while two thirds came from nonhousing services. Housing (rent) inflation and nondurable goods outperformed our forecasts but the outright acceleration from Q4 to Q1 was negligible.
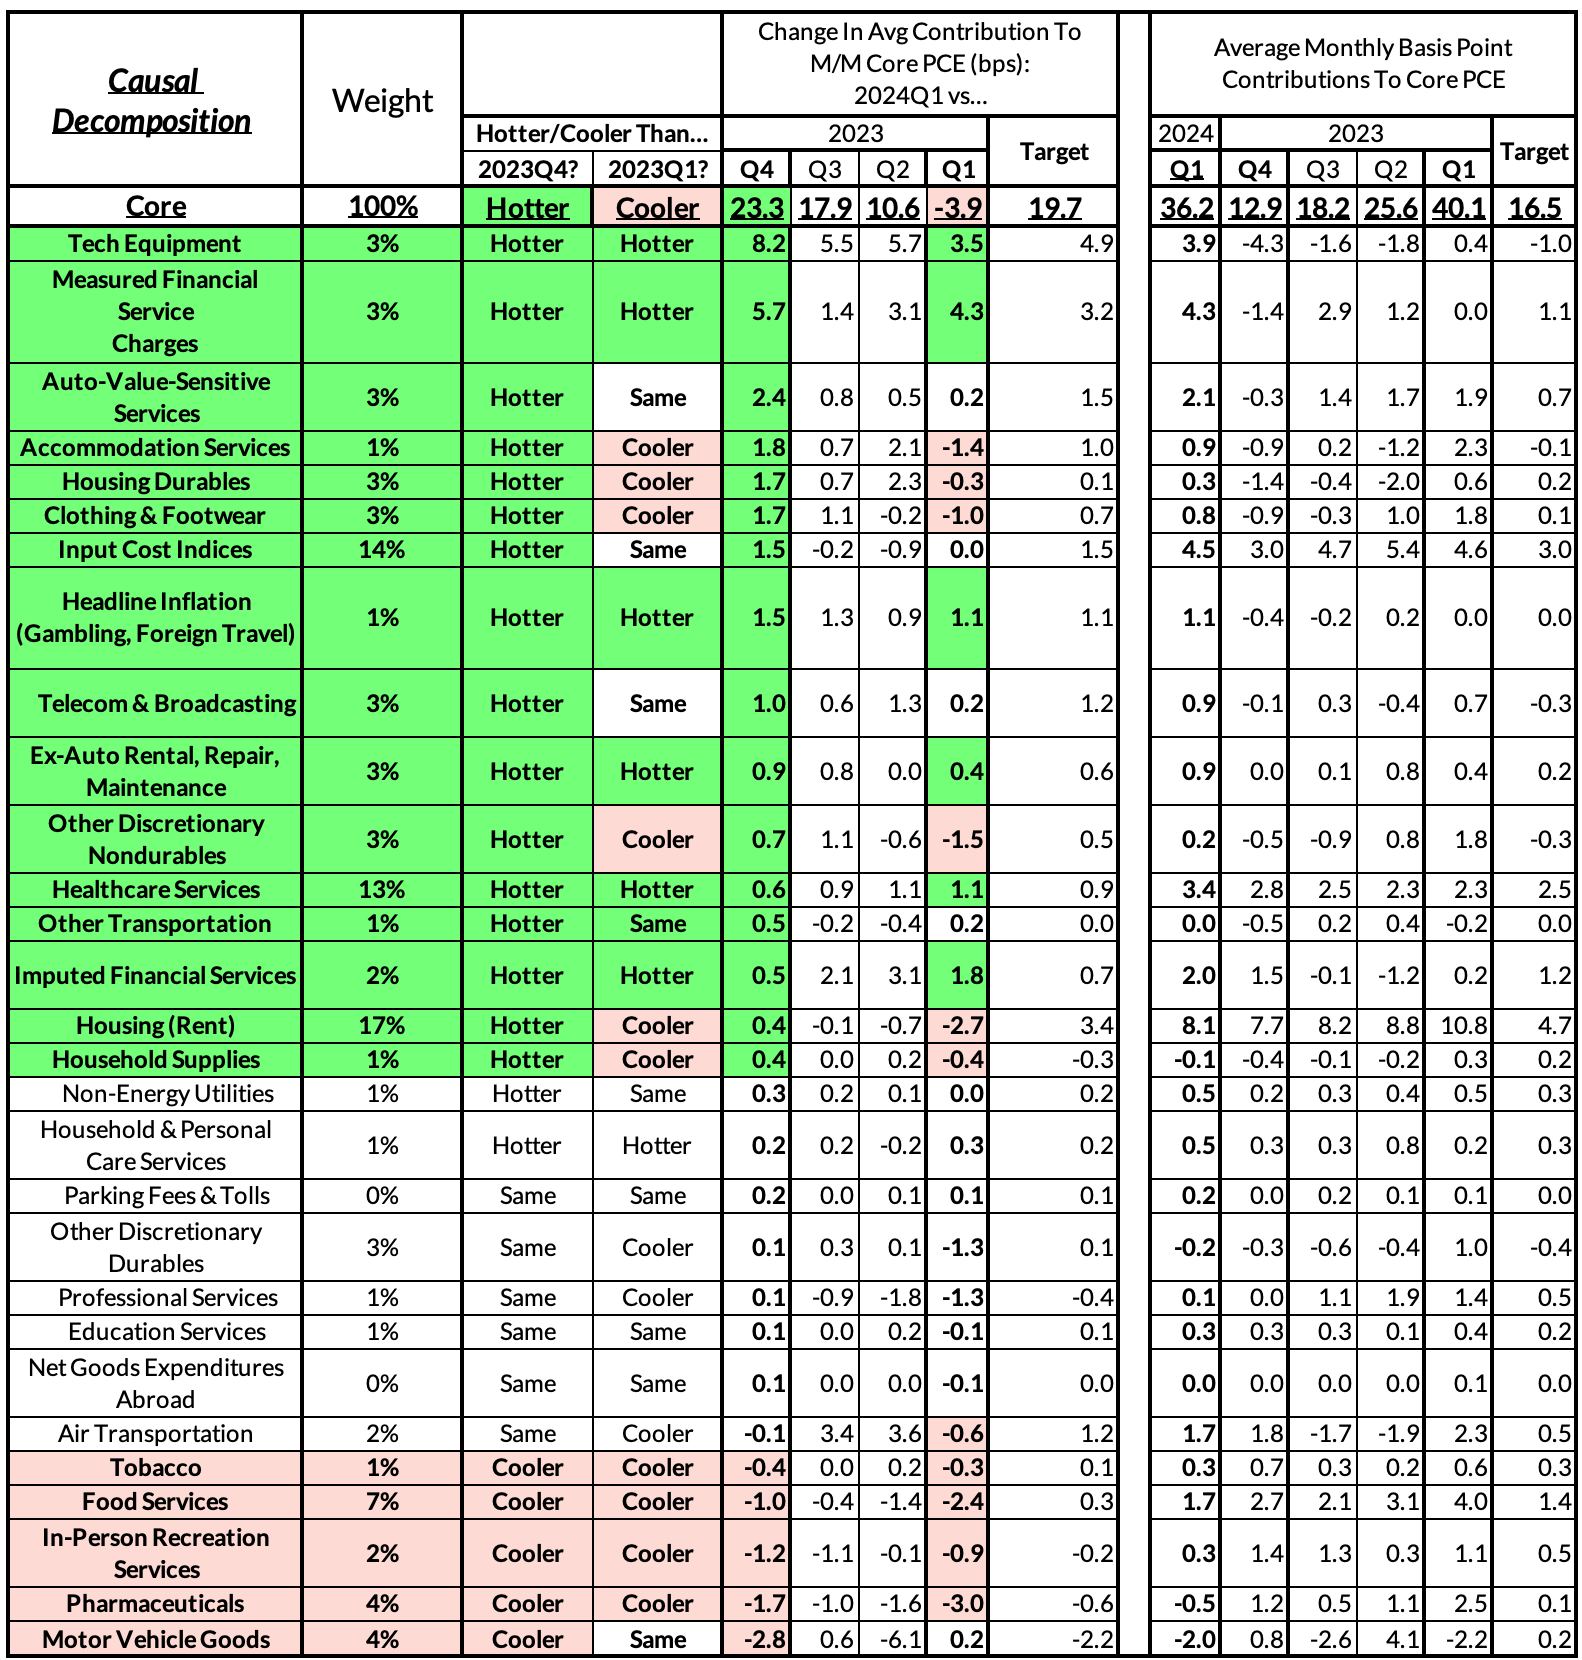
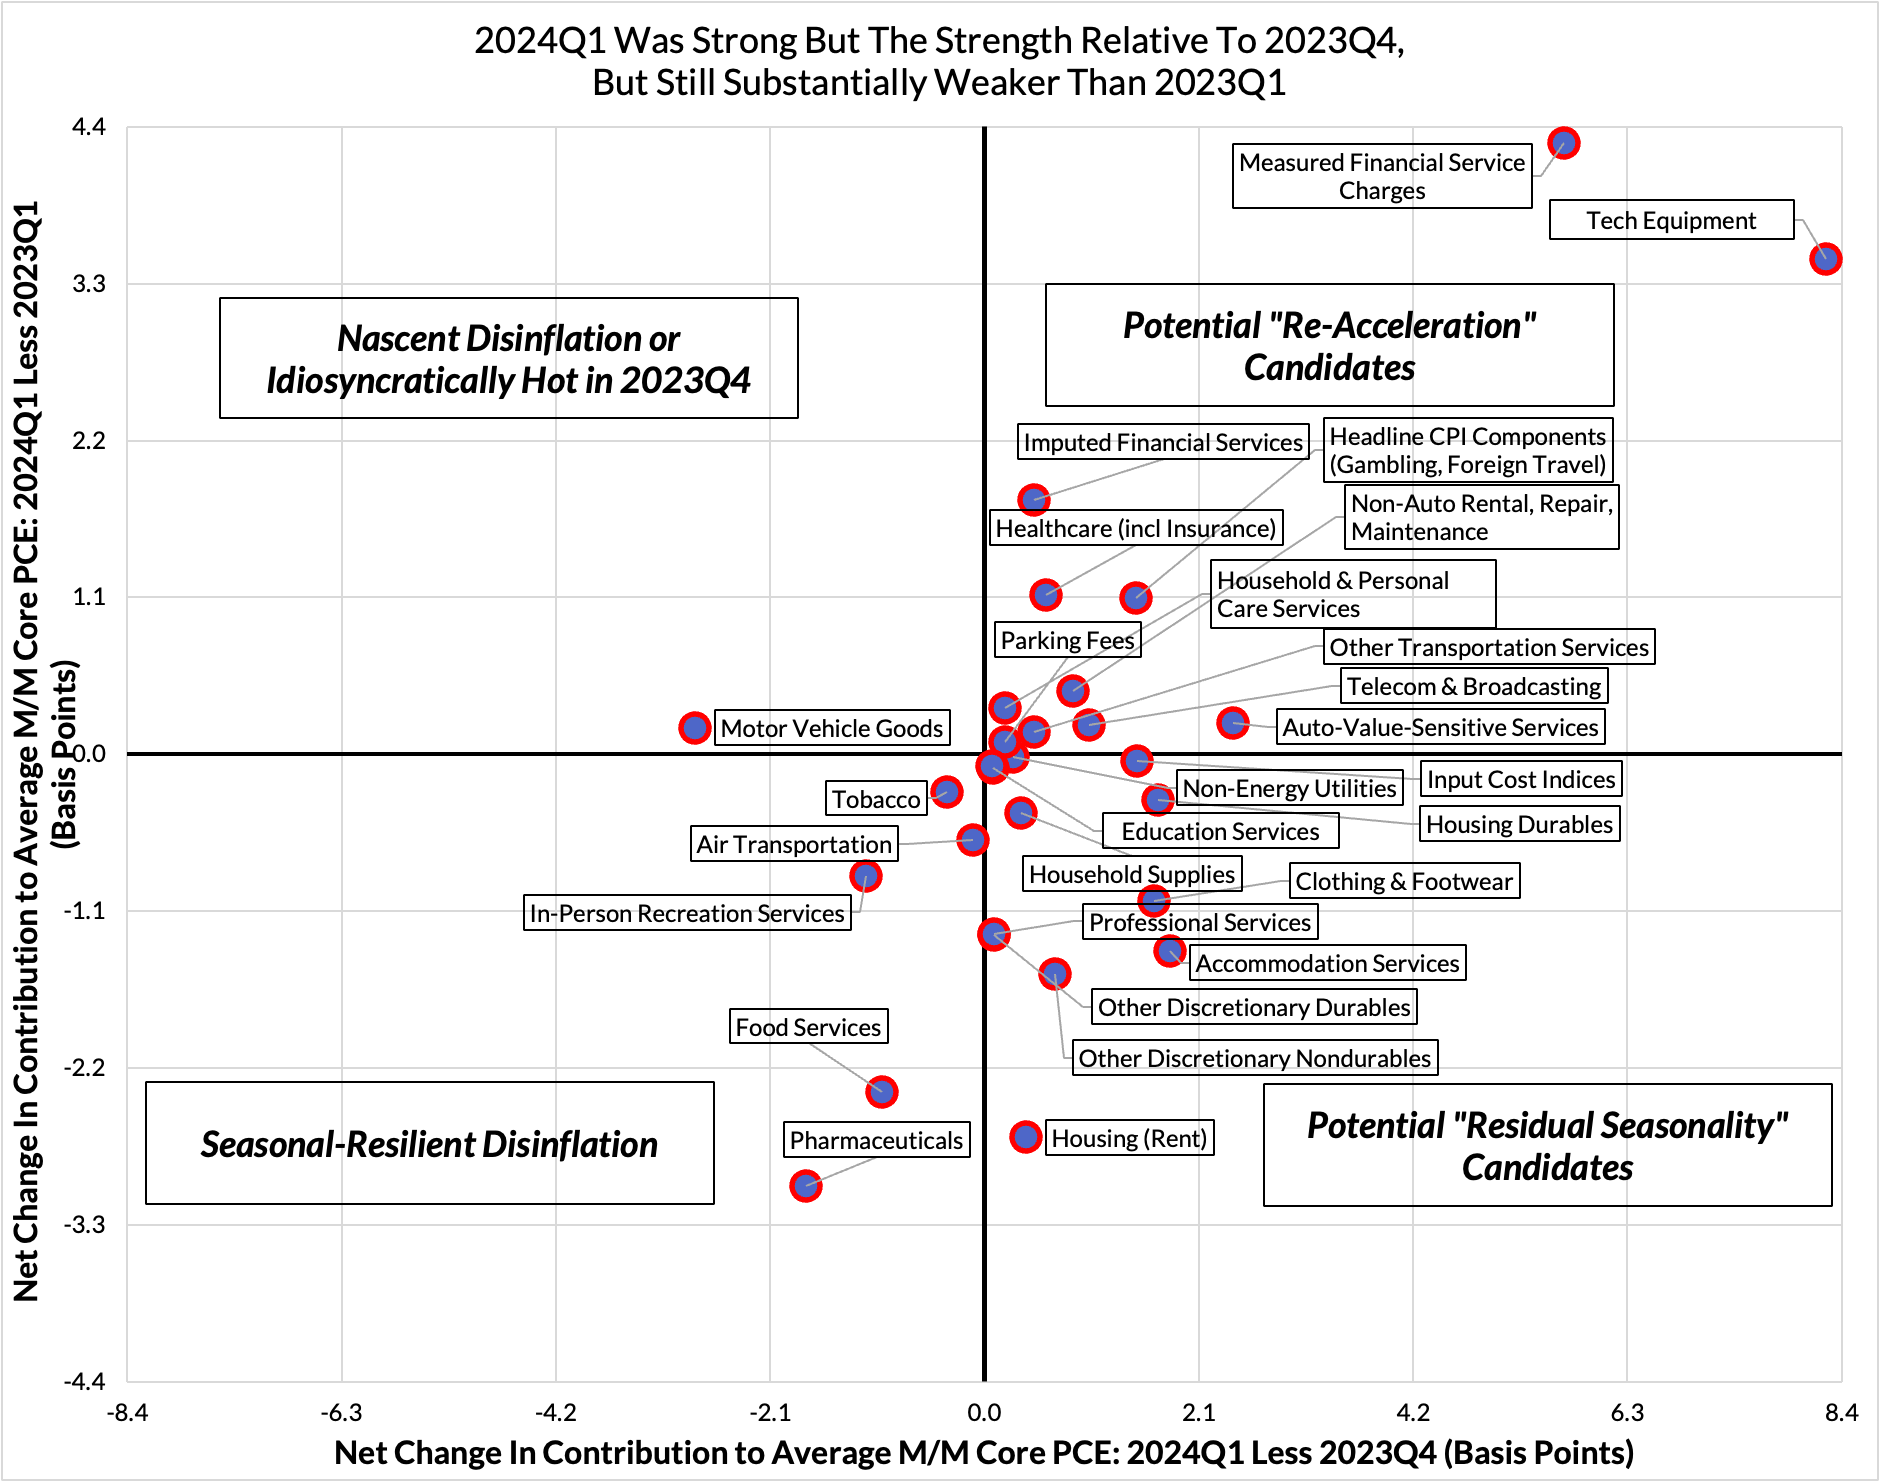
The follow-up question from here should be what particular durable goods and nonhousing services proved to be most pivotal to the Q4->Q1 acceleration, and what does that say about the causal structure of what's going on. Moving to our preferred causal decomposition of Core PCE, we see a few key facts that tell us that the main drivers are:
- Idiosyncratic reversals in the pricing of computers and electronics after previously aggressive discounting in 2023Q4. The Q4 pace of deflation here was consistent with noticeably below 2% Core PCE outcomes, but Q1 showed that there was ultimately sharper payback in the new calendar year. In totality, technological equipment accounted for 0.08% of the 0.23% m/m acceleration b/w Q4 and Q1 readings and also ran 0.035% hotter relative 2023Q1 monthly readings. This is one of the clear cut cases where inflation is sequentially accelerating on a monthly, quarterly, and year-over-year basis. That said, we do not see signs that this source of inflation will prove sustained. Local supply and demand conditions look less changed, such that they do not consistently explain both the aggressive deflation of 2023Q4 and the spitback in Q1. What this segment does teach us: other goods prices might be liable to see a final spitback after the turn of a calendar year if they have undergone more aggressive discounting previously.
- Stocks matter: measured financial services prices ran much stronger in Q1 after a surprisingly cool Q4. Financial services PCE is primarily driven by how PPI measures portfolio management service prices...which methodologically track equity market performance. This segment alone accounts for 0.06% higher m/m readings in Q1 relative to 2023Q4, and 0.04% higher m/m readings relative to what transpired in 2023Q1. We have two core takeaways here: (1) we should see local relief in this segment now that equity prices have cooled off their pace of appreciation, and (2) the path to sustained disinflation through the rest of the year may be feasible only insofar as the Fed simultaneously maintains a sufficiently hawkish posture. While the Fed doesn't mechanically affect most prices in the conventional direction, this is one specific and volatile segment where that can be true. Given the recent run of inflation, the Fed has some incentive to keep a ceiling on financial conditions easing until broader signs of disinflation reemerge.
- Residual seasonality helps explain a lot of breadth in Q4->Q1 reacceleration. Residual seasonality should not be used as a catch-all to explain all of the acceleration in inflation in Q1, but it is true that for a substantial share of components and causal themes that we track in our heatmaps, Q1 inflation was still meaningfully softer in 2024 relative to 2023 despite running hotter relative to 2023Q4. Apparel and housing equipment stand out most noticeably. At least 0.08% of the acceleration in monthly prints from Q4 to Q1 followed from this dynamic in our view. We have seen through the pandemic that firms are growing more inclined to discount heavier in the latter half of the year, and raise prices following the turn of the calendar year.
- We still saw some signs of more sustained disinflation amidst all of the disappointing news. Most helpfully, food services prices have steadily disinflated and even did so through Q1. This particular component is reasonably steady and sensibly follows grocery store pricing dynamics. With that in mind, there should still be more disinflation in the pipeline, enough so to perform at or below what's consistent with 2% Core PCE over time. Pharmaceuticals also saw more sustained disinflation relative to both 2023Q4 and 2023Q1. Where we would be most skeptical of 2024Q1 sectoral disinflation: in-person recreation services. Chunky drops in spectator sports CPI helped contribute this outcome but it seems unwise to extrapolate from these outlier outcomes.
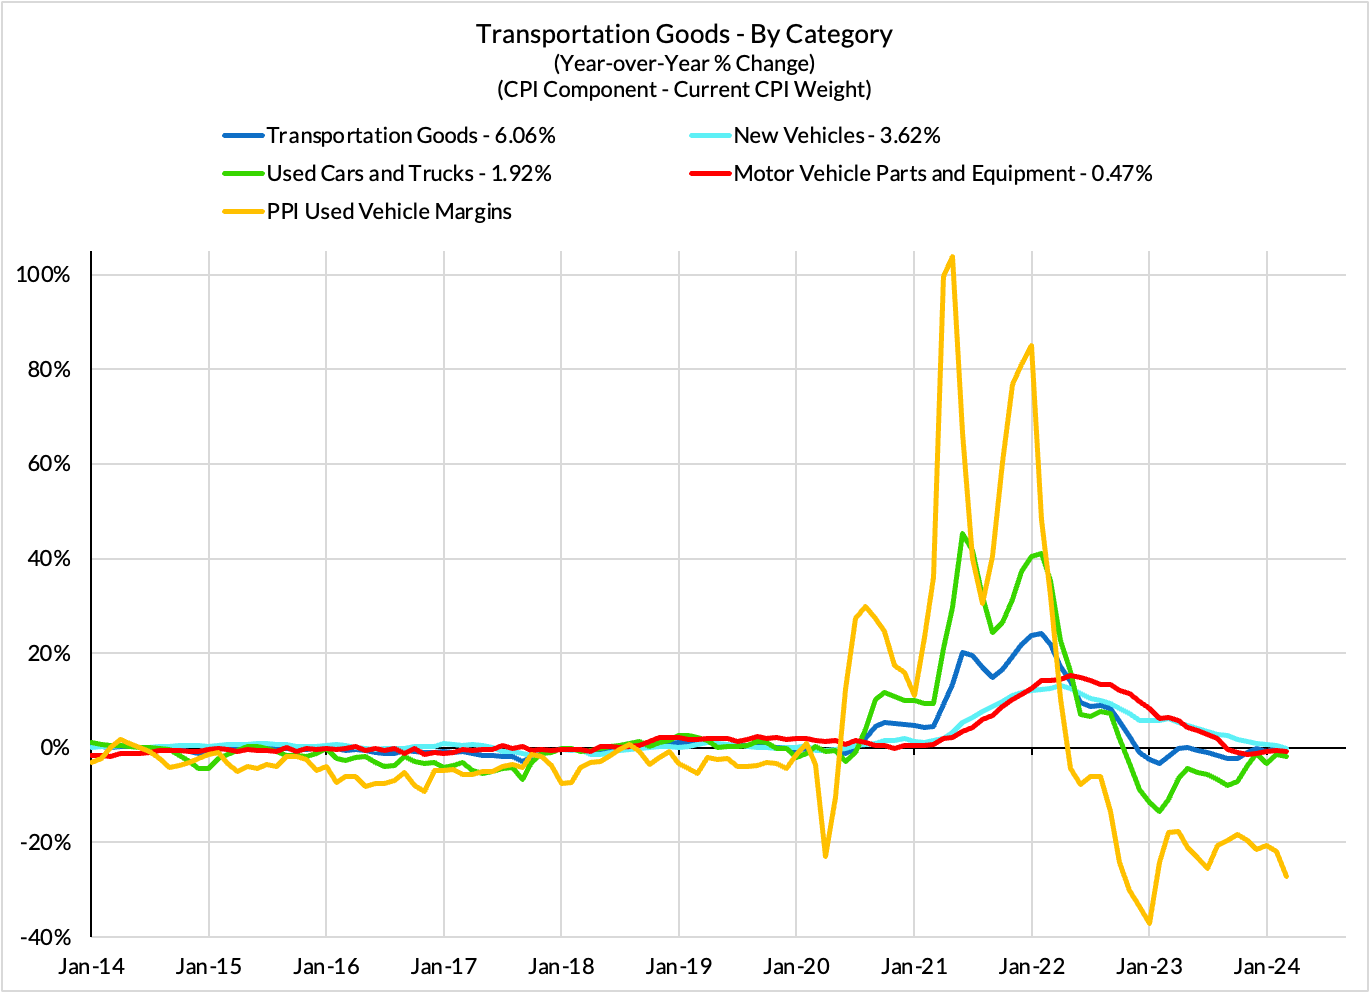
- We still see little payoff from dropping new vehicle prices and flattening market rents, but there is little reason to wholly abandon the thesis: Market prices for new vehicles are falling. Used car prices have continued to decline across most private sector estimates (though varying by source). These dynamics should filter into services pricing. While vehicle insurance CPI commands substantial attention, the cost of car and truck leasing was a bigger contributor to hotter Q1 PCE inflation outcomes. The auto bottleneck has imposed plenty of two-way volatility, but we still see more signs that relief will translate into softer goods and services prices.
- As with all bottms-up inflation assessments, there's room for new issues to crop-up: We try to be holistic and comprehensive but like everyone, are liable to miss emerging dynamics. If you see something that we're missing, give us a shout. We're always open to revising our views in the face of new evidence and superior reasoning.
CPI Charts
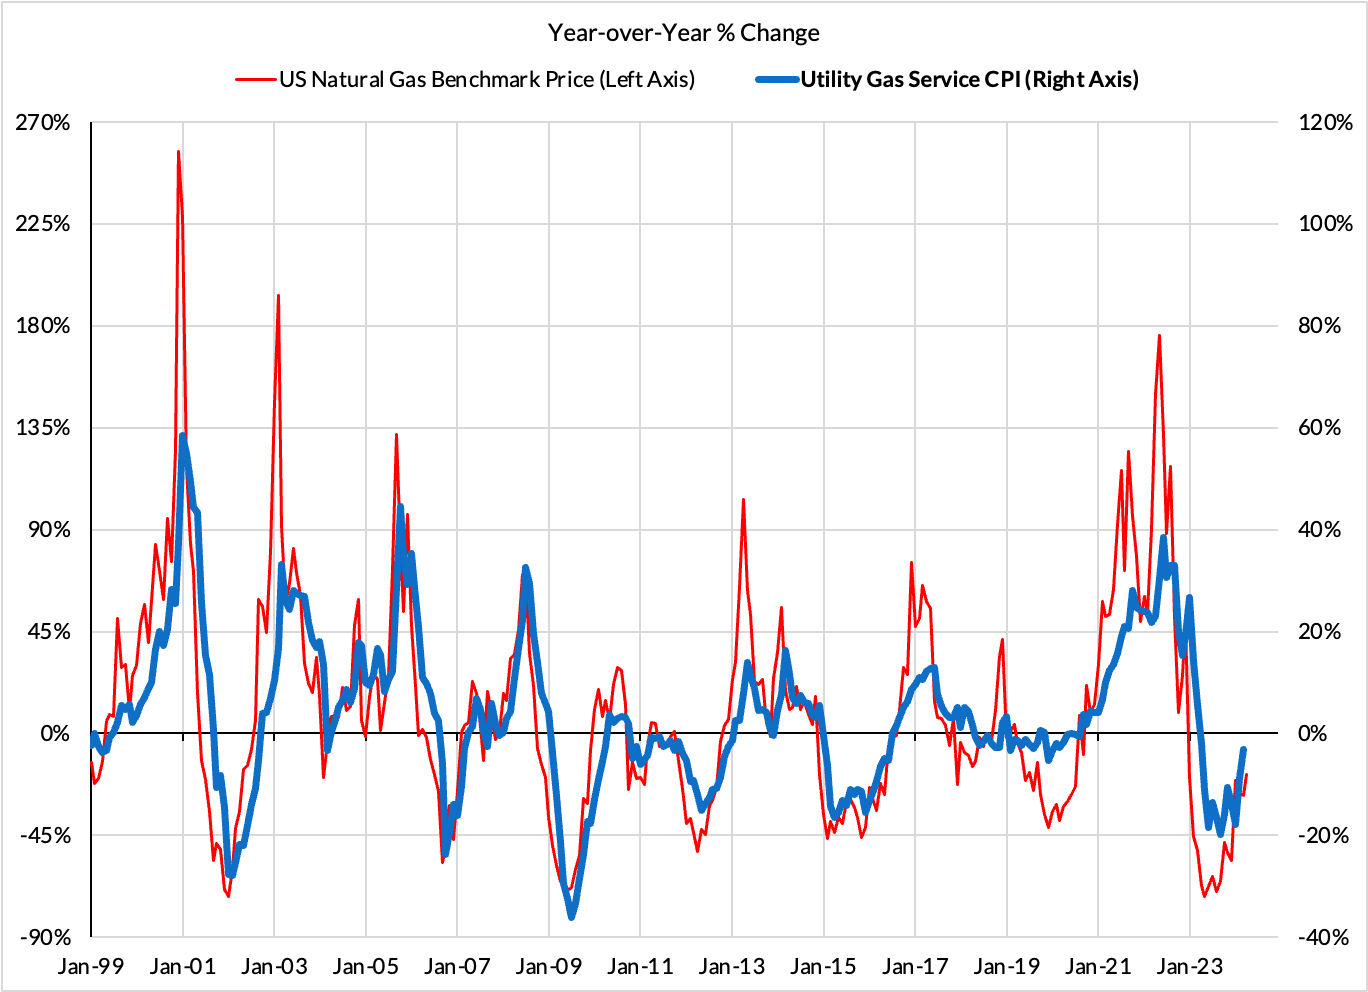
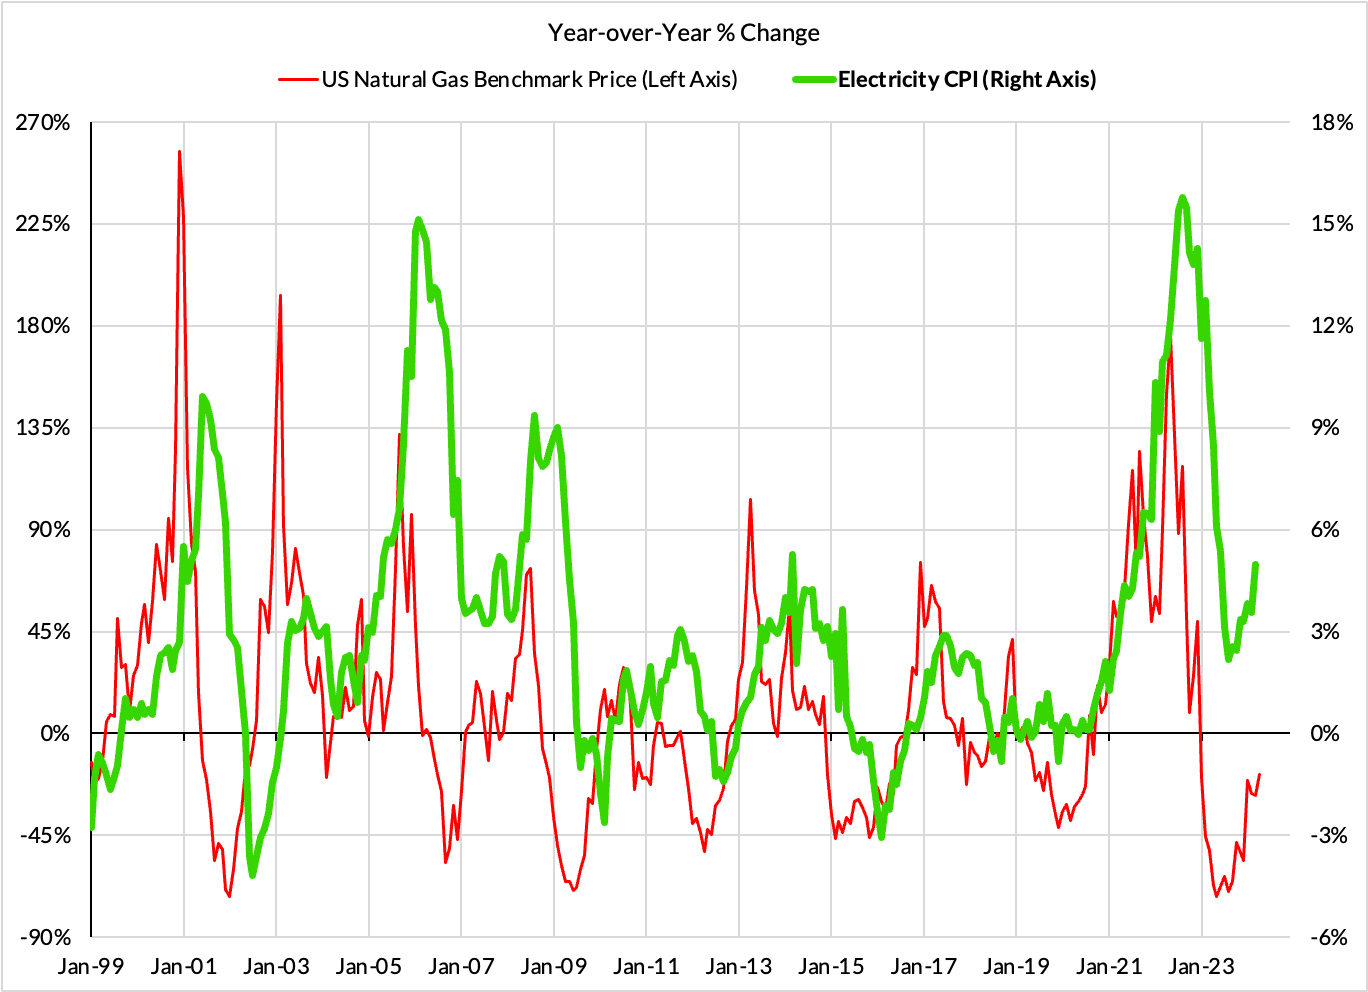
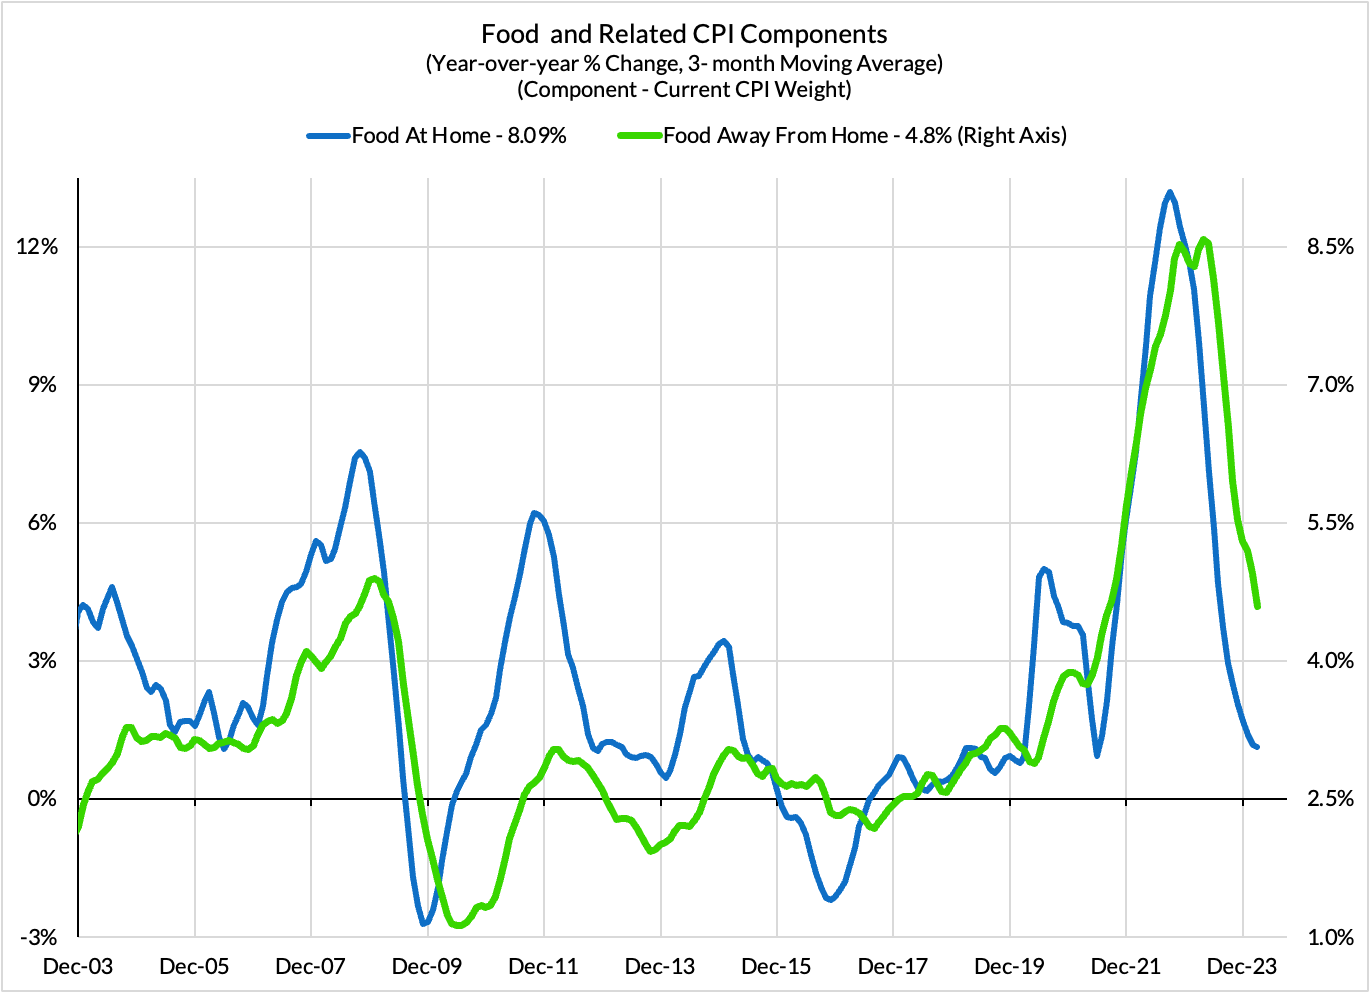
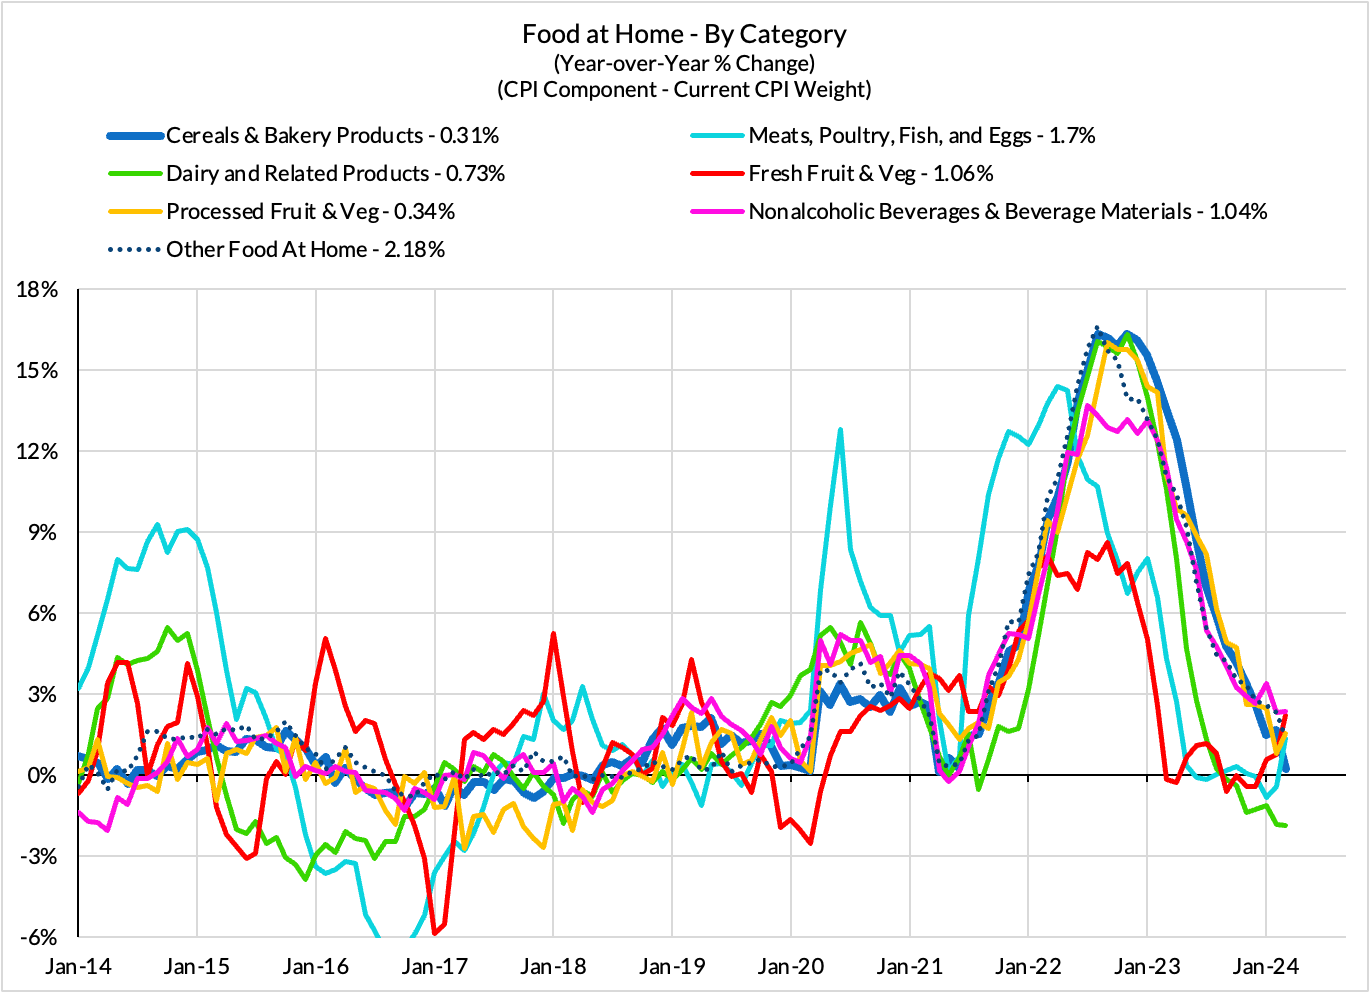
Non-Core CPI Components
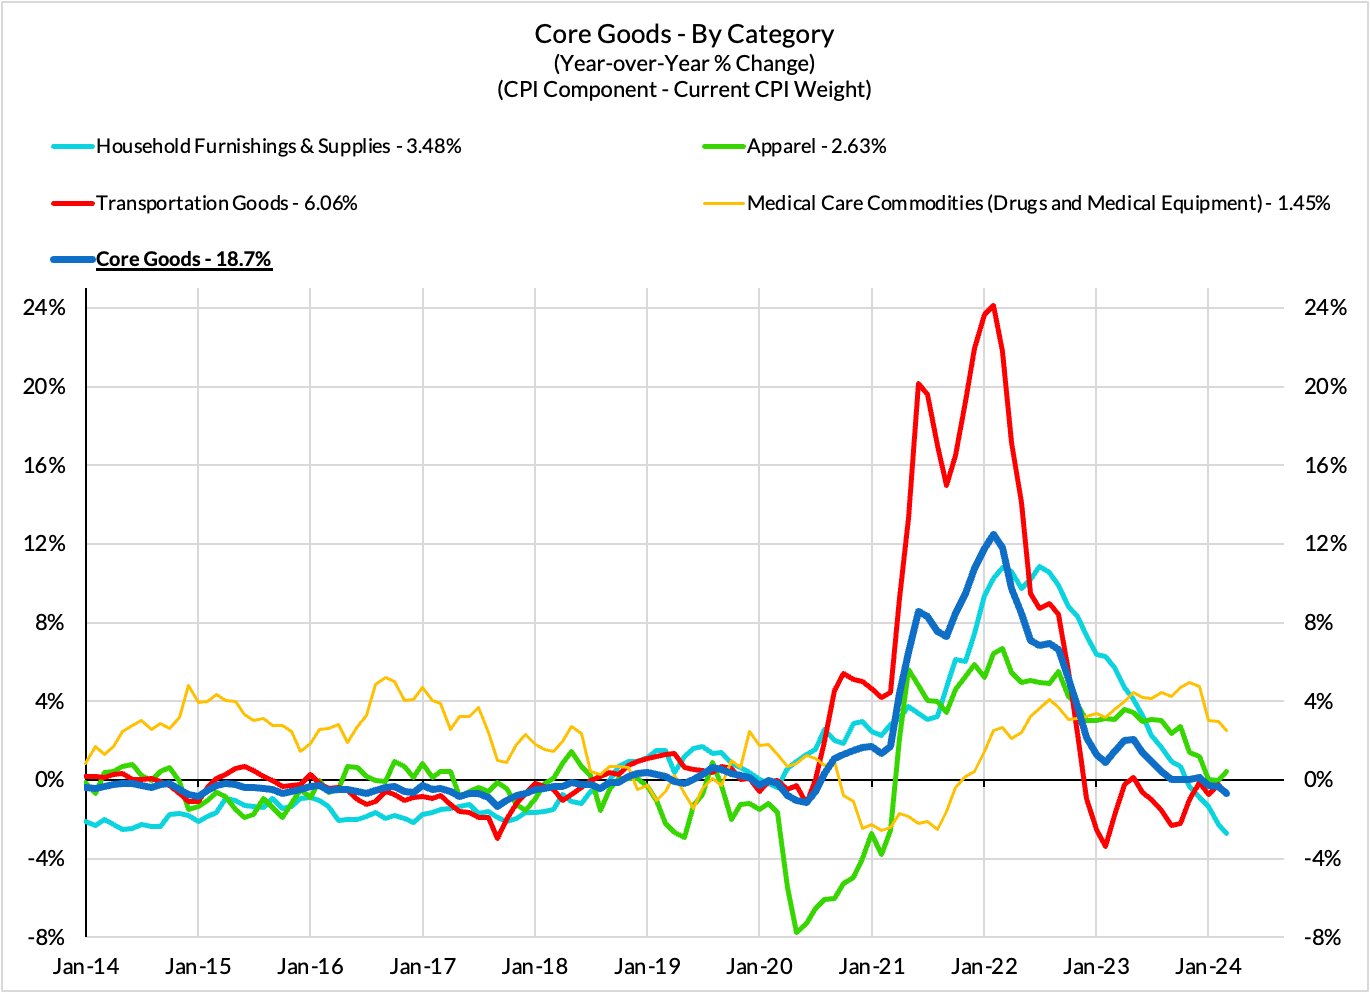
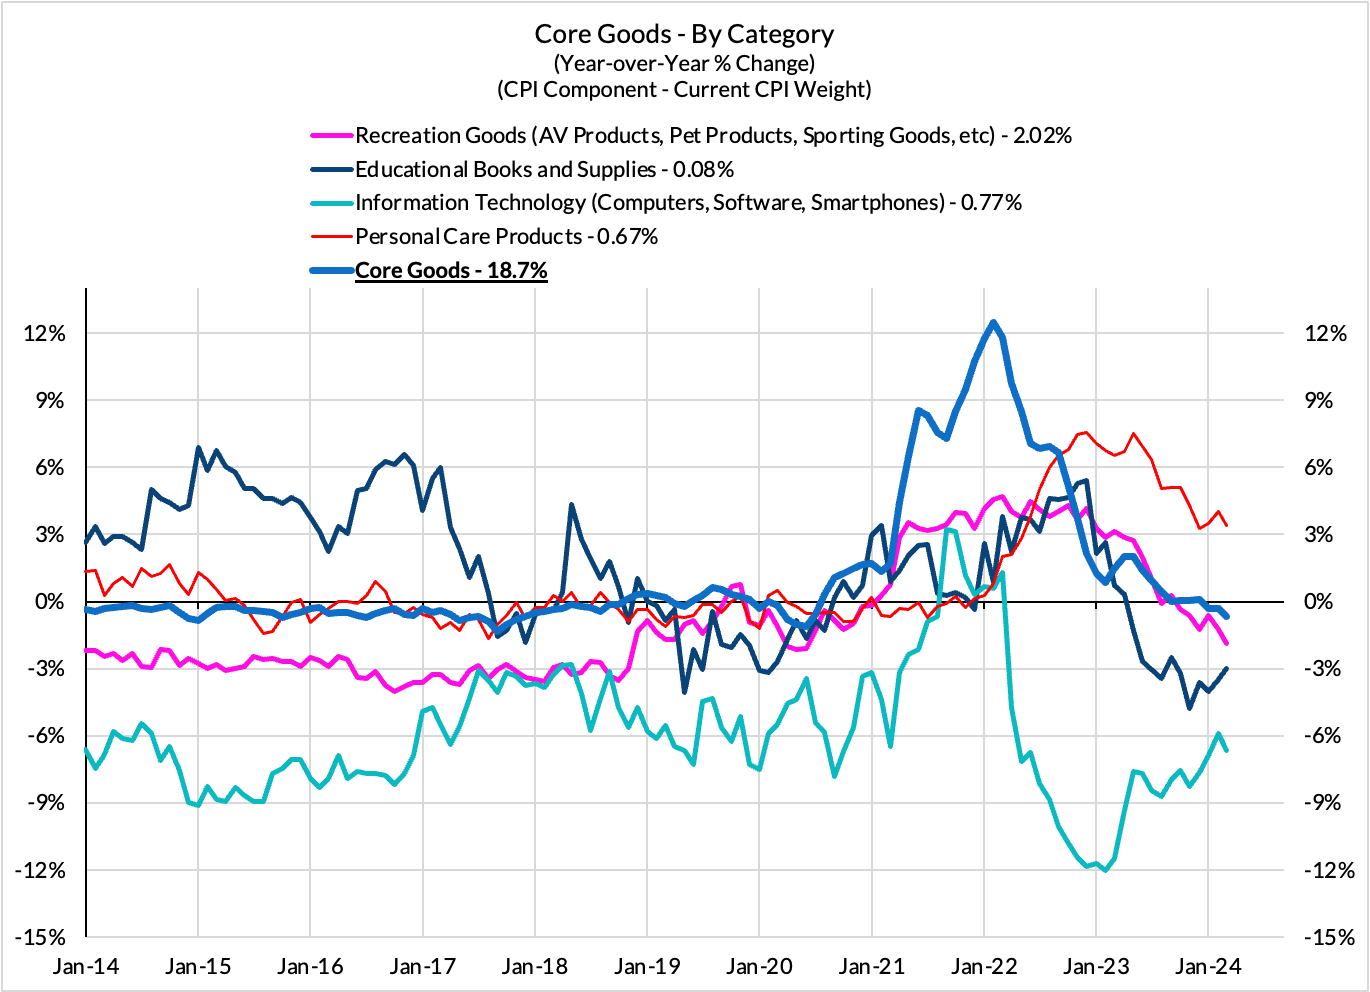
Core Goods CPI Components
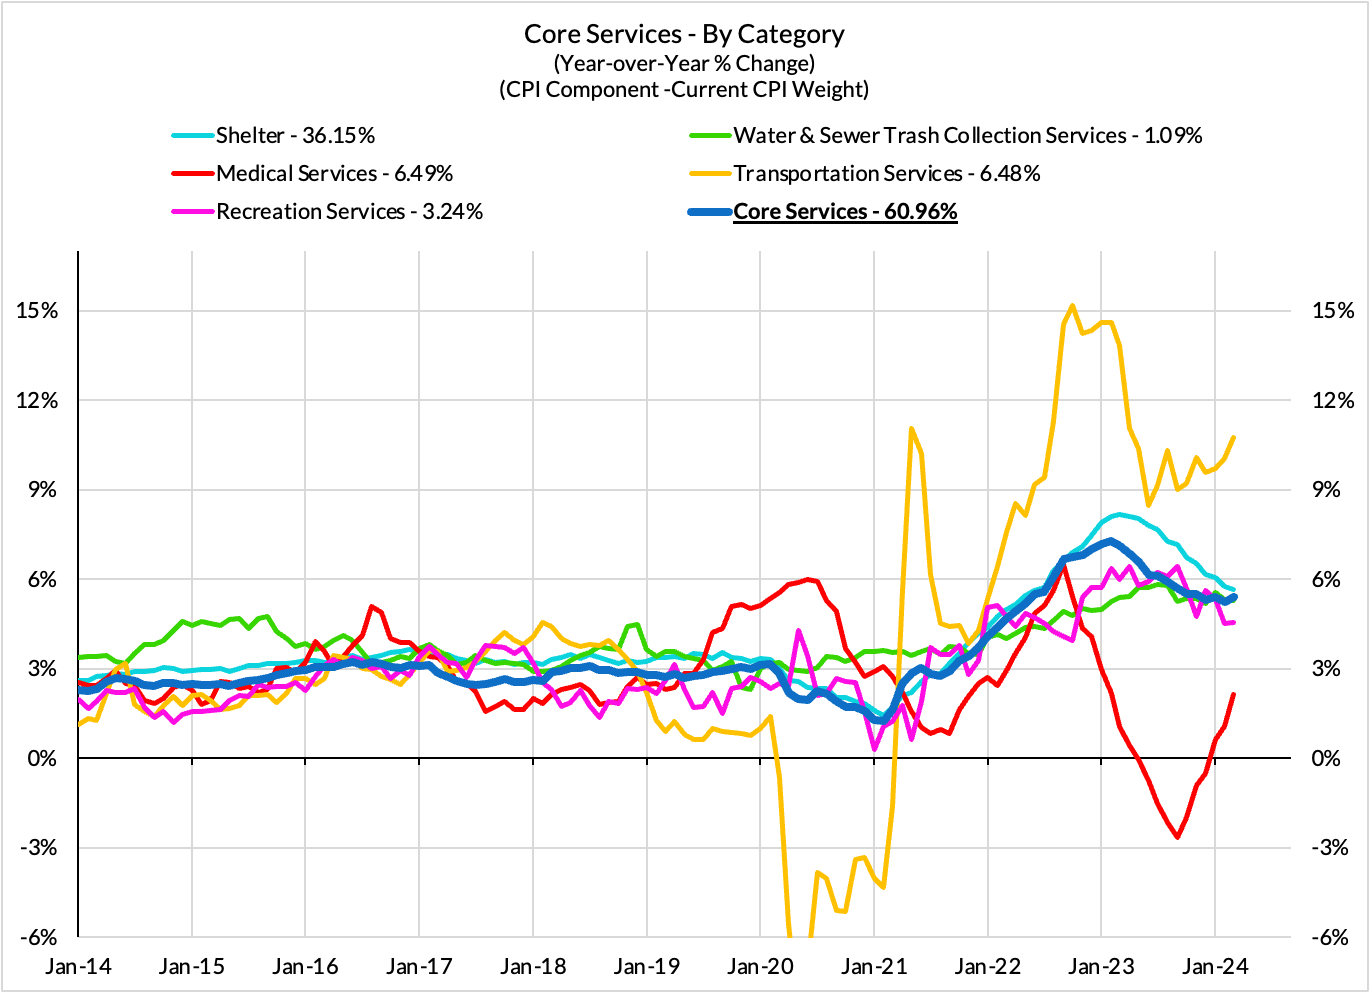
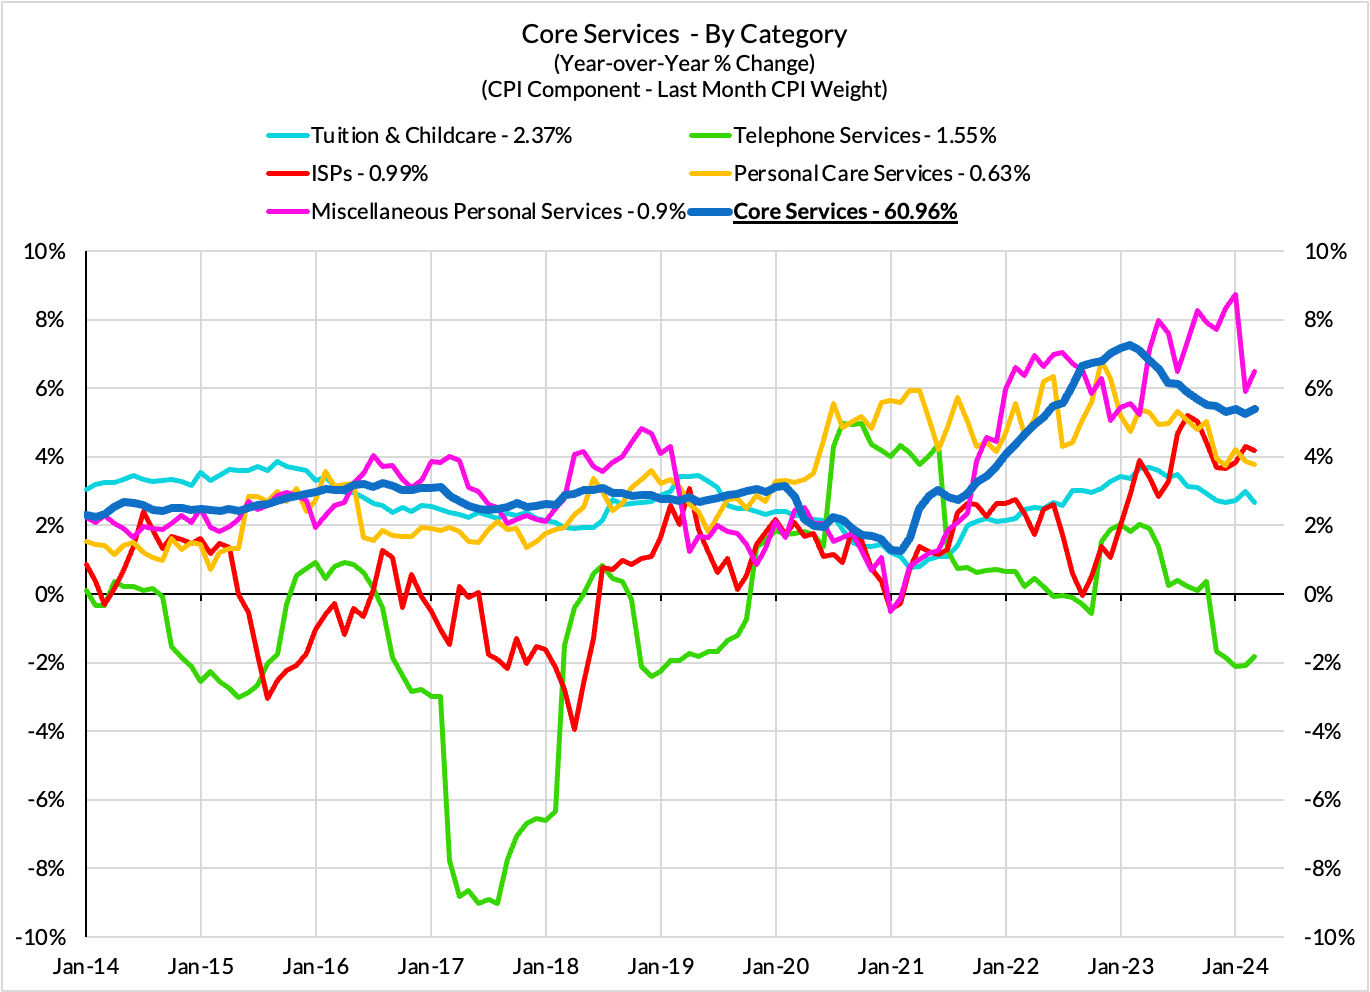
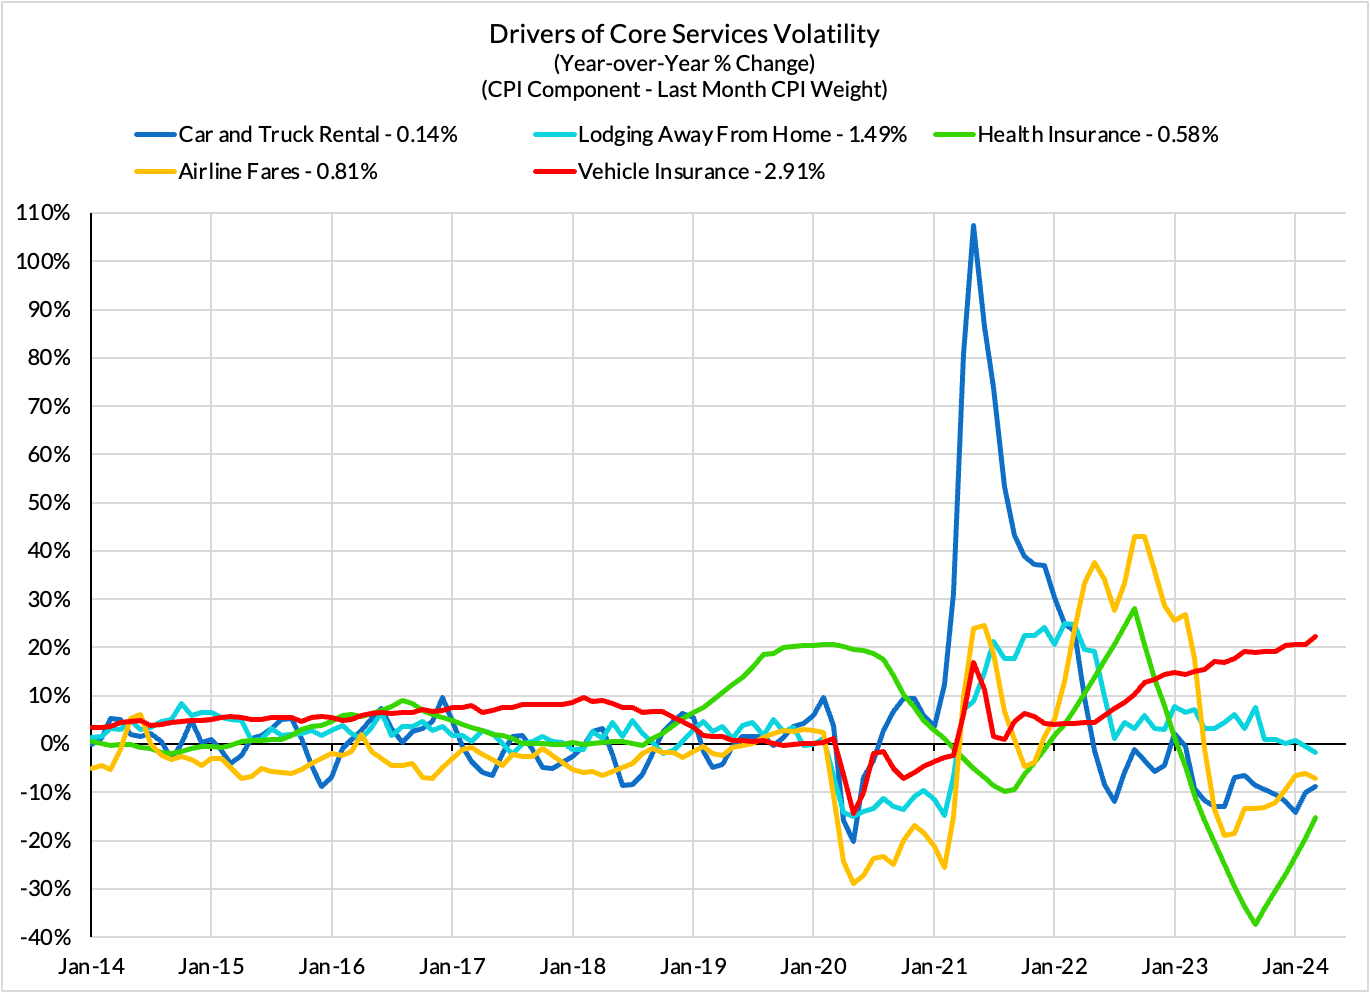
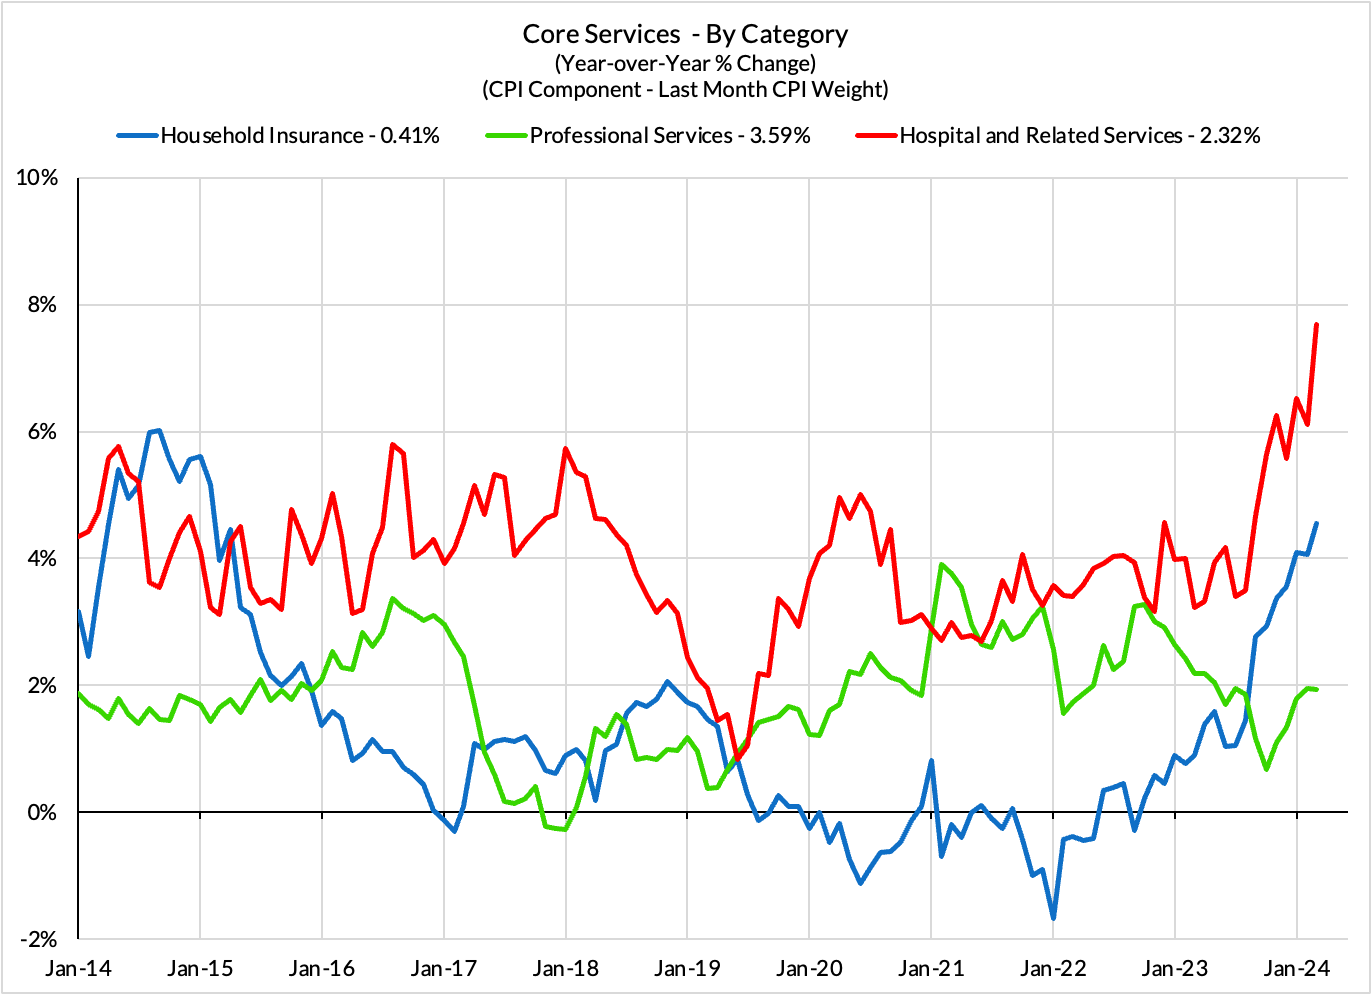
Core Services CPI Components (Not All Feed Into Core PCE)
From Last PCE Recap
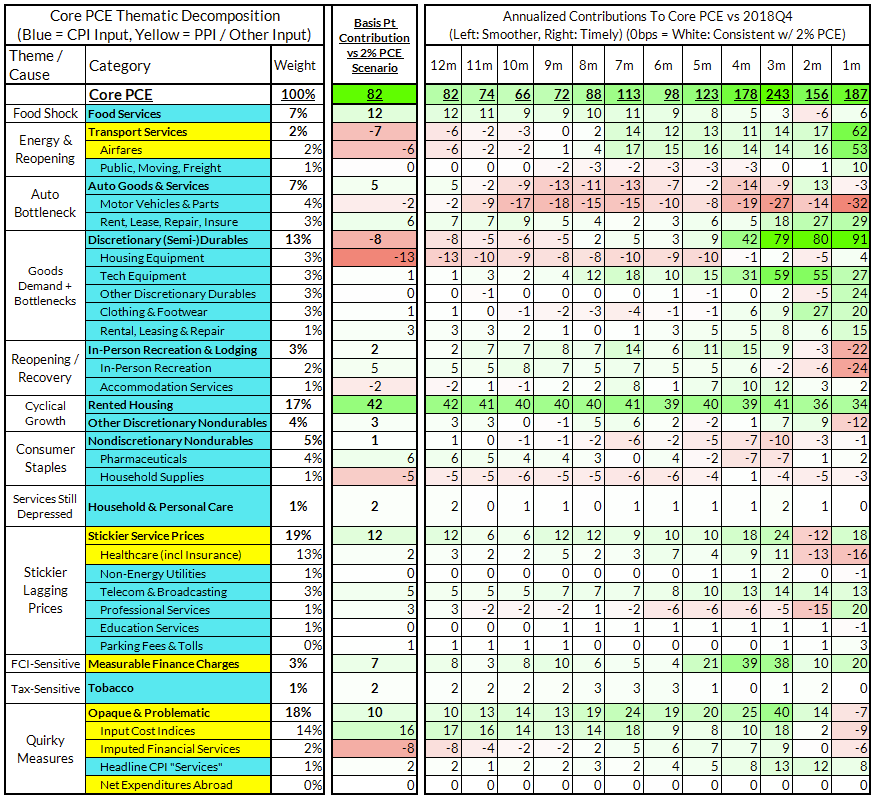
For the Detail-Oriented: Core PCE Heatmaps
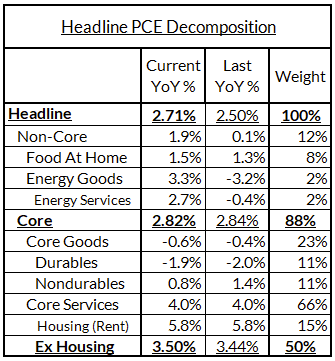
Core PCE (PCE less food products and energy) ran at a 2.82% year-over-year pace as of March, 82 basis points above the Fed's 2% inflation target for PCE. That overshoot is disproportionately driven by catch-up rent CPI inflation in response to the surge in household formation (a byproduct of rapidly recovering job growth) and market rents in 2021-22. Rent is contributing 42 basis points to the 86 basis point core PCE overshoot.
There are other contributors to the overshoot:
- Some more supply-driven (food inputs likely added 12 basis points to the overshoot, motor vehicle bottlenecks adding 5 basis points)
- Some more demand-driven (in-person recreation and travel services likely added 2 basis points to the overshoot)
- Some oddball segments have aggravating effects (measured financial service charges now likely adding 7 basis points, while contributions from input cost indices and imputed financial services likely adding 8 basis points to Core PCE vs 2%-consistent outcomes).
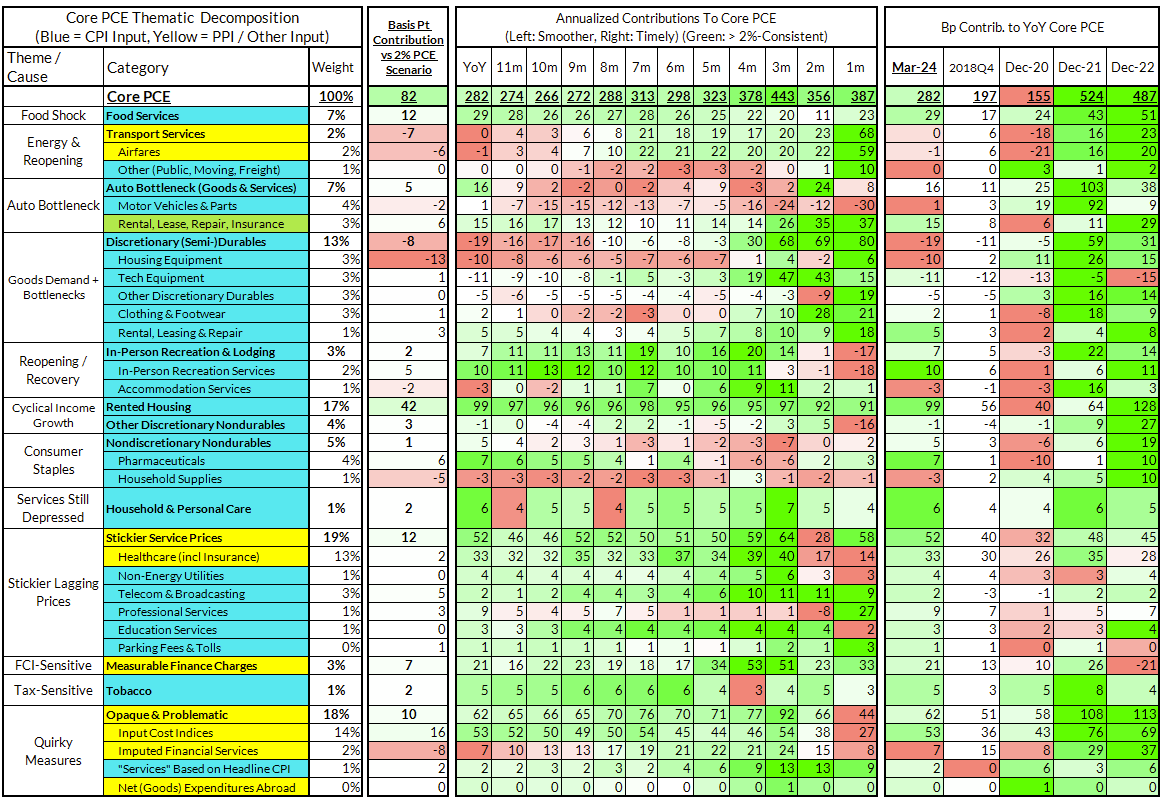
The final heatmap below gives you a sense of the overshoot on shorter annualized run-rates. March monthly annualized core PCE yielded a 187 basis point overshoot vs 2% target inflation (3.87% annualized).
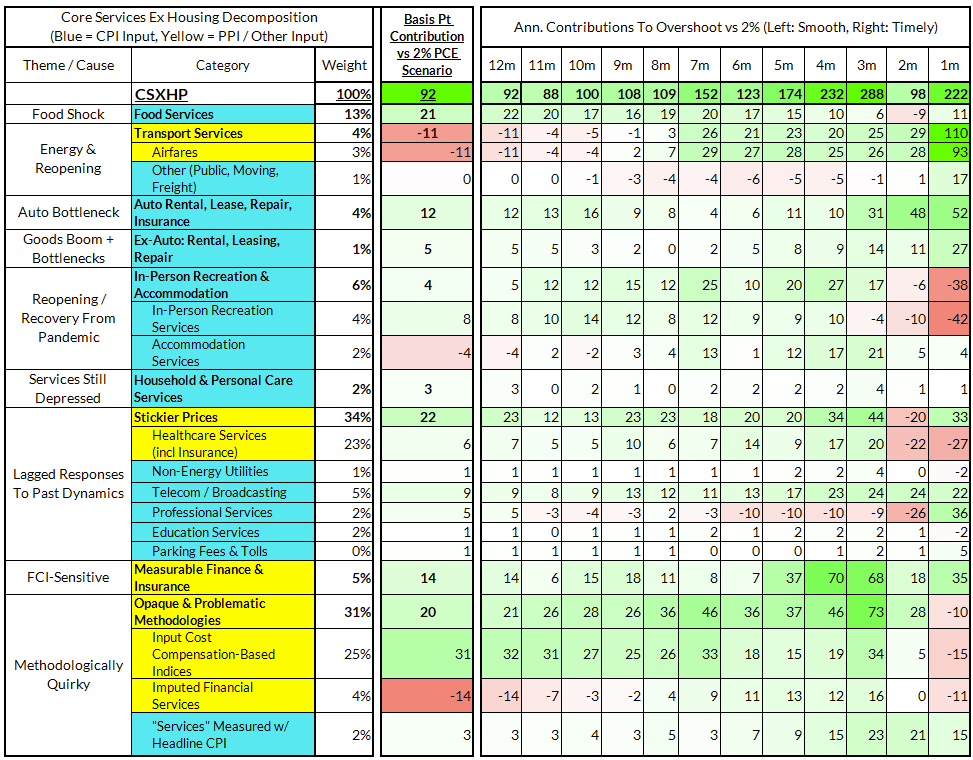
For the Detail-Oriented: Core Services Ex Housing PCE Heatmaps
The March growth rate in "Core Services Ex Housing" ('supercore') PCE ran at 3.50% year-over-year, a 92 basis point overshoot versus the ~2.59% run rate that coincided with ~2% headline and Core PCE.
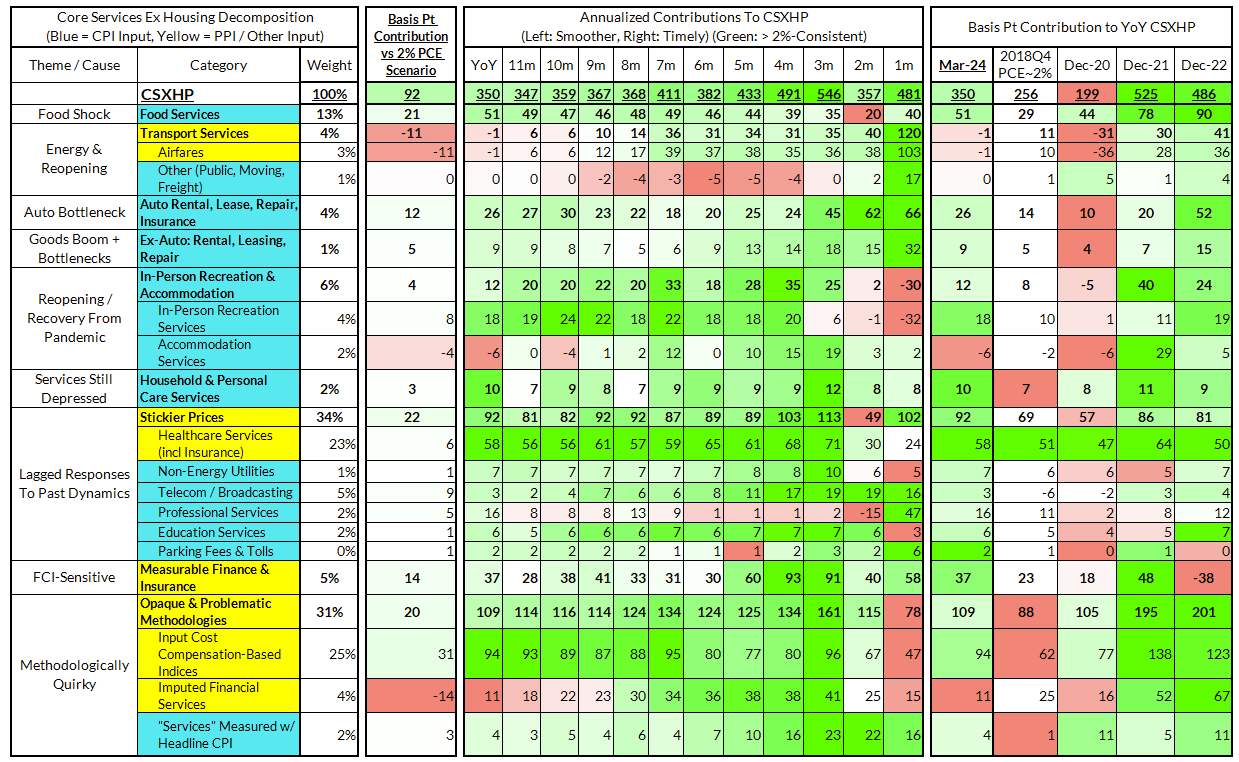
March monthly supercore ran ata 4.81% annualized rate, a 222 basis point annualized overshoot of what would be consistent with 2% headline and core PCE.
Past Inflation Previews & Commentary
- 2/12/21: The Good, The Bad, and The Transitory
- 10/27/21: Offsetting Persistent Inflationary Pressures With Disinflationary Healthcare Policy
- 11/8/21: Q4 CPI Preview: What Will Hot Q4 Inflation Tell Us About 2022 Dynamics?
- 12/9/21: November CPI Preview: Planes, Constraints, and Automobiles: What to Look For in a Hot November CPI Print
- 2/9/22: January CPI Preview: Calendar Year Price Revisions Skew Risks To The Upside in January, But The Balance of Risks May Shift Soon After
- 3/9/22: Feb CPI - Short Preview: Inflection Points - Headline Upside (Putin), Core Downside (Used Cars)
- 4/11/22: March CPI Preview: Managing The Endogenous Slowdown: Transitioning From A Rapid Recovery To Non-Inflationary Growth
- 5/10/22: April CPI Preview: Subtle Headline CPI Upside, But Core PCE Should Reveal More Disinflation
- 6/9/22: May Inflation Preview: Peak Inflation? Not So Fast, My Friend. Upside Surprises Loom Large
- 7/12/22: June Inflation Preview: Lagging Consensus Catches Up To Hot Headline, But Relief Nearing…
- 8/8/22: July Inflation Preview: Finally, Fewer Fireworks
- 9/9/22: August Inflation Preview: Can Used Cars & Gasoline Overcome The Rest of The Russia Shock?
- 10/12/22: September Inflation Preview: Timing The Goods Deflation Lag Amidst Hot Inflation Prints
- 11/12/22: October Inflation Preview: When Will We See The 'Real' Goods Deflation Materialize? Until Then, Rent Rules Everything Around Me
- 12/12/22: November Inflation Preview: The Goods Deflation Cavalry Is Coming, But OER Can Upset An Optimistic Consensus Tomorrow
- 1/11/23: December Inflation Preview: Risks Skew To The Downside, But Upside Scenarios Remain Plausible
- 2/12/23: January Inflation Preview: Residual Seasonality & Stickier Services Pose Upside Risks
- 3/9/23: February Inflation Preview: Q1 Upside Risks Remain. Goods and Reopening-Sensitive Sectors Matter More Than Wages
- 4/8/23: March Inflation Preview: The Fed Seems Unaware We're Entering Another Automobile Inflation Storm
- 5/7/23: April Inflation Preview: Can PCE Silver Linings Overcome CPI Bite from the Used Cars Wolf and a "Slow Slowdown" in Rent CPI?
- 6/9/23: May Inflation Preview: Last Month of Used Cars Driving Upside Risk?
- 7/9/23: June Inflation Preview: The Path To The Fed's 2% PCE Goals Is Getting Clearer But Not Soon Enough To Forestall a July Hike
- 8/8/23: July Inflation Preview: Used Car Downside Can Hasten Path To 2% Core PCE Outcomes
- 9/12/23: August Inflation Preview: CPI Risks Growing More Balanced Even As PCE Risks Tilt More To The Downside
- 10/10/23: September (Pre-PPI) Inflation Preview: The Wedge Will Matter Again...Pulling Up CPI and Pushing Down PCE
- 11/13/23: October Inflation Preview: A Data Release That Can Dictate The Future of The Hiking (& Easing?) Cycles
- 12/11/23: November Inflation Preview: Headline Downside But Can Core PCE Keep A March "Normalization Cut" In Play?
- 1/10/24: December Inflation Preview: How Much More Disinflation Can Be "Banked" Before Q1 Begins?
- 2/9/24: January Inflation Preview: High Stakes Data Releases With Fat Tails On Both Sides
- 3/9/24: February Inflation Preview: Jan-Feb Residual Seasonality Poised To Stoke Upside & Headfake The Fed
- 4/9/24: March Inflation Preview: Relief Growing More Likely Over The Residual Seasonality Hump